So lets look at the chart of the S&P 500
I didn't include the MACD or the volume however I will comment briefly on them
MACD is below the 0 line which is bearish, however, the momentum has shifted to bullish with a strong positive tick on the histogram.
The volume was quite weak last week. This entire rally has been on below average volume which is why i am suspect of this rally. If there was strong bullish volume next week taking us above the 200 MA I might start considering longs.
The Slow Stoch I included to show how steep the incline has been. From what I have noticed with the slow stoch is that the shallower (flatter slope) the entry above the 80 line has a greater chance to embed. Ideally you will have a gradual increase of the yellow line. The reason for this is that as the yellow line crosses the 80 line the index becomes over bought. If the white line quickly enters the 80+ zone the chance for the stock / index to embed is much higher. But in this case the yellow line is signally overbought condition, the white (trialing 5 MA line) is below 50. It will be 2-3 days overbought then it has a chance to embed. This is unlikely and i suspect to see a pull back / break down next week.
The candle sticks show continuation patterns so they are bullish.
As for trend lines, I had the white line in earlier and look where resistance was perfectly found. The white trend line is significant as it is the top of the down trend channel that was formed from the may flash crash and the recent rally 1130 mark.
In theory, entering a short now isn't a bad call as the market is over bought however, i will wait to see how the market receives Obama's speech that has taken place as the market does seem to jump on good news / stimulus news.
Metal market update.
Two topics that will be discussed is why silver could have more potential than gold? and silver breakout potential.
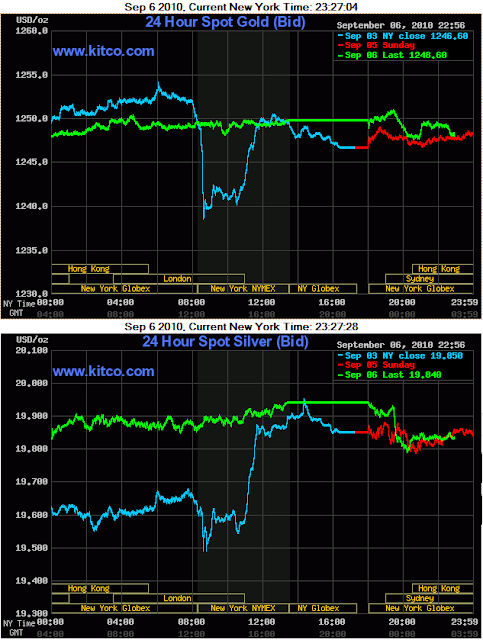
First lets look at what happened Sept 3rd which is the light blue chart for both.
The interesting thing about silver is that sometime is trades as a precious metal like gold and other times it trades like a industry metal like copper. This is simply because it has been used as a currency I believe longer than gold has been used and it is used in thousands of consumer goods such as cell phones, audio equipment and medical applications. Looking at the price action, as gold drop on the "good" (less bad) economic news, gold took a steep $10+ drop. Silver had about a 15 cent drop but quickly recovered. What is the most interesting is that as gold recovered silver followed it upwards to touch the 19.90 range. So when the economic data came out, silver traded down with a weak correlation with gold as the market data helped keep the silver prices high (as an industrial metal) then as gold traded higher the silver price has a strong correlation. This is why I think in the world of QE, where the gold market gets a boost and the general market gets a boost (look at the 2009 bull rally in both markets) silver may out perform gold.
About the Break out in silver, it currently is trading at a very high part of its over all range. It closed at the 19.95 area on monday but has since come a bit down to the 19.85 range. the $20 is significant but i believe the $22-$23 area is the most significant as breaks above this will take us most likely to $32 / oz in silver. This would be a massive 60% move. With low COMEX inventories and increased demand in medical applications silver will be interesting to follow over the next 2-3 years. In addition, if gold gets to 1300 this year expect to see silver rally strong with it.


No comments:
Post a Comment