Market Scheming

Showing posts with label CIEN. Show all posts

Monday, April 18, 2011

CIENA Chart - Future Expectations, indebtness, and raising interest payments


Quick look at Ciena (CIEN).
This stock appears to be rolling over, the MACD looks like it will cross this week, if it can't hold the 0 level, it could indicate longer term trend change to bearish.  The Slow stoch also shows a roll over and If you plan on buying this stock it would only make sense to wait until the Slow Stoch is back closer to the 20 level.  However, My expectations are that the stock will head back to the 200 MA which should be closer to the $20 mark. This level corresponds to a pivot high in May 2010 as well so should be decent resistance.  This means close to 20% drop in the stock over the next couple of months, especially if the markets roll over which they appear they might be again.

While the US has been shook by S&P credit watch, I look at highly leveraged companies such as CIENA as at the whim of debt markets.

Here are some ratios to be worried about.  These are from Reuters.

Financial Strength

Company Industry Sector S&P 500
Quick Ratio (MRQ) 2.42 1.72 1.57 0.68
Current Ratio (MRQ) 2.99 2.07 2.63 1.00
LT Debt to Equity (MRQ) 1,516.52 20.42 14.36 113.76
Total Debt to Equity (MRQ) 1,516.52 30.62 39.19 161.87
Interest Coverage (TTM) -74.37 2.32 0.60 17.35

I question the LT DEBT to Equity as it appears extremely high however, I do know that Ciena on all accounts is much more indebted than competitors.  With Ciena's acquisition of Nortel's MEN division required substantial debt instruments to fund it (mainly convertible notes).

A couple of interesting parts from the Annual report (2010).

Outstanding indebtedness under our convertible notes may adversely affect our business.
     At October 31, 2010, indebtedness on our outstanding convertible notes totaled approximately $1.4 billion in aggregate principal. Our indebtedness could have important negative consequences, including:
    increasing our vulnerability to adverse economic and industry conditions;

    limiting our ability to obtain additional financing, particularly in light of unfavorable conditions in the credit markets;

    reducing the availability of cash resources for other purposes, including capital expenditures;

    limiting our flexibility in planning for, or reacting to, changes in our business and the markets in which we compete; and

    placing us at a possible competitive disadvantage to competitors that have better access to capital resources.
     We may also add additional indebtedness such as equipment loans, working capital lines of credit and other long-term debt. 
Below is the interest payments per quarter from Q1 2009 up to Q1 2011.  Remember that the MEN acquisition occurred officially in Q1 or Q2 2010, hence an increase in Debt payments.  The trend, however based on 9 quarters, is troubling especially with the above warnings included above from the company.  
Mainly this point should be highlighted:
"Limiting our ability to obtain additional financing, particularly in light of unfavorable conditions in the credit markets"
  
Lastly, I note found in Ciena's Annual report (2010) which is a failed logical flow.
Failure to maintain effective internal controls over financial reporting could have a material adverse effect on our business, operating results and stock price.
     Section 404 of the Sarbanes-Oxley Act of 2002 requires that we include in our annual report a report containing management’s assessment of the effectiveness of our internal controls over financial reporting as of the end of our fiscal year and a statement as to whether or not such internal controls are effective. Compliance with these requirements has resulted in, and is likely to continue to result in, significant costs and the commitment of time and operational resources. Changes in our business, including the MEN Acquisition, will necessitate modifications to our internal control systems, processes and information systems. Our increased global operations and expansion into new regions could pose additional challenges to our internal control systems. We cannot be certain that our current design for internal control over financial reporting, or any additional changes to be made during fiscal 2011, will be sufficient to enable management to determine that our internal controls are effective for any period, or on an ongoing basis. If we are unable to assert that our internal controls over financial reporting are effective, our business may be harmed. Market perception of our financial condition and the trading price of our stock may be adversely affected, and customer perception of our business may suffer.
Assertion 1: Failure to maintain effective controls over financial reporting could have material consequences
Assertion 2: Compliance to Section 404 of the Sarbanes-Oxley Act of 2002, costs the company time and money
Assertion 3: Business changes and the acquisition of Nortel's MEN will require changes (posing additional challenges) to internal controls
Assertion 4: Management doubts current design for internal controls will be sufficient to enable management to determine internal controls are effective for "any period"
Assertion 5: If they cannot assert that the internal controls are effective, the business maybe harmed
Assertion 6: Market perception of the financial condition may be adversely affected (stock price drop).

A1 -> create a need for effective controls
A2 -> a complaint that adhering to the law will cost the company money
A3 -> an admission that internal controls do in fact require a change
A4 -> an admission that the current internal controls cannot be trusted as they may not be effective over "any period"
A5, A6 -> This indicates that just lacking the ability to assert that their controls are effect will harm business leading to a stock correction / financial difficulty.

Very convoluted way of saying that they really don't know if their projections can be trusted and admitting that this will hurt them at some point.

Tuesday, November 16, 2010

S&P breaks down: GM IPO only 2 days away...... oh no!

Yesterday I called out some levels that I believed would be key for today.  The levels were marked in Purple.


On the 5 minute observe the opening of the day.  Once the purple line was broken, there was a test within the first 15 minutes then on the second test the purple level was held perfectly, and the sell off began. If I had  the time I would have used that failed test as an entry point. 

Technicals:
ADX is the highlight today, a sell signal has occurred as the DI- crossed above the DI+.
MACD, Slow Stoch: both continue to signal momentum gaining for the bears.
Volume was quite strong today for the bears as well.  This could be the turn date but again, a bounce is expected and that bounce I will be shorting


I did however get into SDS a bit late in the day.
The purple line is the same level percentage wise as the purple line in the S&P 500.  The green line was my entry that I setup yesterday.  However, due to a human error the order I setup didn't get executed.

Mistakes are learning experiences, and i will not make this mistake again.
What happened was I used a Buy - Stop - Limit Order rather than Buy - Stop.
The difference is that when the level 27.07 was touched, the stop part gets triggers and the order becomes a limit.  If that price is never seen again which is what happened is the limit order never gets triggered.  Instead if I used just a simple Buy - Stop order, when the stop price gets touched the order becomes a Market order and will trigger the sale at what ever the market price would be.  In this case probably 27.08-27.09.

However, I did get in a bit later at 27.16.   And I have locked in a break even stop loss.  I am not expected much from this as my entry was glitchy but at least I have an in the money position in case tomorrow heads south again.  Hoping no decent size gap up, occurs tomorrow i this could be a solid starting entry if the selling continues, if not limited risk as I am setup for break even.


CIENA update.  Put option @ $14.00

I have been holding Put options for Ciena at a strike price of 14.  I have already mentioned in previous posts, I regret not selling this at the beginning of November as there was still a large amount of time value left and would have yielded a substantially higher price.  The price broke through 14 later in the day only to regain the level.  However the close price is a cent below the 20 MA which could signal that even if the markets are flat tomorrow Ciena could have a sell off.  If that is the case, i might take the opportunity to sell my options.   As options ex is friday, it will be very hard to time the sale of these.  If there is a strong down day again >1% I think a sale would make sense, if there is a flat day, I might hold until thursday.

Why is Thursday is so important?  GM IPO, news articles have been hyping this up, and they have apparently increased the share price by 14% to $32-$33 due to increased interest.  This is a chance for the US gov to get back part of their money, and in some ways is symbolic of the success of QE and stimulus.  The US gov was given a large portion of the GM shares in exchange for a bailout.  With the stimulus package and the subsequent QElite and QE2, the markets have rallied and it is time for them to turn a profit.  If the market is overall on shaky grounds on that day and the GM IPO tanks its first day, it could be a strong signal for the loss of faith in the current system.  I might be taking this out of context however, I do believe there is a level of symbolism behind this IPO.

Wednesday, November 10, 2010

Ciena Update and Silver Comex margin adjustment

I still stand by what I mentioned yesterday that I probably should have sold my put options a couple of weeks ago as there was more "time value" on them.  However, looking at the overall markets which had a slight pull back today, which could be the start of a bigger move down, however, I am not jumping on the short side yet as the first POMO of QE2 is tomorrow and if they want to halt big move down they have the ability.  Upwards of 10-15 billion could be injected tomorrow maybe more.  If there is some more selling I will ensure that i have a post explaining bear arguments and any positions I take.  The issue is that the rules of the game have changed, with the size of QE2, it is hard to predict downside movement as every other day the FED has the ability to pump in a massive amount of liquidity into the system.  But I do believe in free markets and that free markets will always win out in the end so a 10%-15% sell off is not off the table.  The issue right now is Europe as there is a lot of negative news coming out from countries such as Ireland, Spain, Greece again.


 Lets look at Ciena isolation.
With this move to the upside on QE2 announcement, we see that it has found resistance at the 50 and 200 MA.  I mentioned in a previous Ciena review that I doubled my position on Oct 25th when we retouched the 50 MA.  These levels are quite important and will continue to be heavy resistance unless bulls take charge in a decisive manner shortly.
For candle stick formations you can see that yesterday there was an inverted hammer formation with today being a confirmation that that signal is valid.  Again, if 20 billion of liquidity enter the market tomorrow all bets are off. 
The stock is also overbought on the slow stoch (not shown) which means a pull back is likely.

The main indicator I wanted to demonstrate today is the MACD.  The histogram has positive ticks which means to me that short term momentum is up, however, you need to be aware of where the MACD line is in relation to the 0 level.  When the MACD line is below 0, the momentum is technically to the down side.  Just like technical levels in price action, the 0 level is very important as if there is still bearish momentum, the MACD line will fail to break the 0 level.  This is what I believe we are seeing now (again in isolation as FED injections are holding prices up).  This will be the first attempt to break the 0 level since the downtrend started.  So i would expect over the next couple of days that the histogram starts to have lower positive ticks.  For anyone that doesn't know the histogram is measured by the difference between the MACD line and the signal line.  If the MACD line is trading under the 0 level like it is now and we get a negative tick on the histogram it means that the MACD line and the Signal line have crossed which is interpreted as a sell signal.

Now for something completely different

  Say it ain't so Silver???
I was just telling some friends about silver and how it is at $29 and how I have maintained a target of $32 since it was in the $17-$19 range.  Then I get home, check my silver / gold mining companies and all my stops were hit.  Lucky me I moved up my stops yesterday night to lock in a solid profit but looking at the Asian market and how silver is now on the climb back up I am a bit annoyed since the stocks could / should rebound quickly.  Due to a busy schedule I am not sure if I will have time to find solid entries into these. 
Also all precious metals got hammered, gold dropped $40 in a few hours.

Remember the silver manipulation case with JPM and HSBC.  The main stream media has finally blown this out of the water.  Anyways, without them suppressing the market, silver has had a hell of a run last few months.  What is interesting is there is some collective knowledge that a massive amount of silver shorts are about to get margin called.  This was around the 28-29 dollar range.  This means that the shorters would be forced to cover, by buying at a very high price resulting in a massive loss.  This buying will result in a short squeeze  causing the price of silver to sky possibly to 32-35 in days.  Well the Comex which is the major exchange for commodities today decided to raise their margin requirements.  This effectively delayed the short squeeze by increasing the price that the margin calls will occur.  The immediate effect is that it allowed more shorts to be entered into the market.  Very curious timing as two large banks are being charged and sued for manipulation that involves massive short positions.  Connect the dots anyway you like but something doesn't seem right with this announcement especially as the margin requirement was only changed for silver.

However, I have not lost faith in silver at all, looking at the 24 clock you can see a gain of $1 from the lows has already occurred, and we are ending Nov 9 higher than Nov 7.  It will be interesting to see how the market reacts in the North American hours.  And how the overall stock market and precious metals correlation holds as QE2 begins and bearish news comes out in Europe. 

As I am effectively out of all long metal positions except for TXG which didn't hit my stop yet, I still have put options on CIENA and the Euro which is also looking weak.  If there is a turn in the markets I am decently positions now, to go short however, if a decoupling occurs, where metal prices continue to rise on debasement of the USD but that debasement of the USD isn't enough to hold the markets up, I may want to go long mining stocks and hedge with a index short.  Possible making money on both trades. 

Lastly, There is an argument that the index has terminated a 5 wave, and a corrective ABC is expected.  Again it might be best to wait on what the size of QE2 POMO tomorrow and the market reaction.


Sunday, November 7, 2010

Stock Markets break out on $600 billion in QE2

Wow, well I guess I will admit I was wrong.  I 100% did not expect the FED to commit $600 billion to QE2.  I hear a lot of people making the connection that after the FED asked the primary dealers (Here) how much money they would like, the FED gave them $100 billion more for good measure.

Well, if you think that I lost money on the announcement you are mistaken.  The day before the announcement I took 2 gold / silver mining positions as a hedge against the announcement.  The logic was if they are going to go all in then commodities especially gold / silver will sky.  Well it worked like a charm, these companies shot up as gold increased almost double the markets that day and broke to new highs a fraction under 1400 (currently 1394.10).  The power of hedging.  I got stopped out of my S&P short. 

One disappointment I will have to admit is I may not see the highs of the Ciena put options again, which I could have sold last week for 250% profit :(

I have my reservations about this pop as the markets are OVER extended and should be topping.

I will keep tight stops in case there is a breakdown but until their is signs of a breakdown (which come on monday if there is a strong down day as this will complete a evening star candle stick pattern)  but with the fed 100% committed to keeping markets propped the game has changed and you have to change also.

My strategy has and will continue to be:
Depending on the trend:
Short Market / put options
Long Metals via mining companies.  I have added some Chinese solar companies recommended by a friend.

The reason I will not go long the stock indexes is simple, gold has outperformed the stock market for a very long time, and this past Thursday is a prime example of the general trend.
S&P 500 up 1.92%
GLD up 3.35%

Another reason to be long commodities rather than stocks is simple, QE from the FED only has direct impact on the stock markets with the US, but Japan, Euro zone, Brazil, UK all might be doing QE soon to combat rising currencies due to the US bold action.  In this case, gold will go up in response because the more fiat currency there is the higher gold will go up.  These additional QE by other countries will not directly boost the S&P 500.


We are now at new highs since April.  The key to watch is if we hold this level and consolidate and continue up or we head for a correction before an additional push.

Markets can't go straight up (unless they are pushed up which is basically the case) but at some point they need to correct.  With this additional stimulus I cannot say there will be a massive correction however, for this rally to be sustained I honestly believe a test of the 200 MA at 1250-1300 needs to occur. 

The strange thing that happened on Friday is that the dollar rebounded a lot but gold and the markets were up? strange yes.  A dollar rally will have to result in a market break down so keep your eye on this.

At this point the FED is all in, there will be $75 billion dollars a month pumped into the system, it is going to be interesting to see how stocks respond. With this coming in gold to $1500 by December to mid- January is not out of the question.  Some of the mining stocks I am holding are SBB (my go to gold stock however it has not preformed as well as others), EDR one of the largest producers of silver, and AXR.  Others i have on my watch list that i have mentioned in the past are GPR, FVI, FR.  FR has done amazingly, since august it is up almost 150% from $4 to $10.  GPR had a massive breakout since the beginning of september it has increase from $0.84 to over $1.50. 

Silver has out preformed gold as expected with JPM and HBSC being under the radar for market manipulation.  Silver just missed the $27 mark on Friday.


Massive rally, around the 17.50 mark I picked up some physical which I was unsure if it made sense at the time, however, now I am quite happy with the purchase. 

Next week will confirm this market rally or be a reversal week.  until there are strong signs of a reverse it is better to stick to the metals, especially if gold breaks the $1400 mark!! 

Thursday, October 28, 2010

S&P Triangle and Ciena update


10 min chart that shows the symmetrical triangle that we are in.... and guess what?  The ultimate end of the triangle (the point) is...... *drum roll*  November 3rd FOMC Meeting and expected QE2 announcement isn't that a coincidence?


The Daily has basically not moved for 4 days.... today we had a nice doji candle that continues to signal indecision in the markets.   The Slow Stoch shows clearly bearish divergences that predict a breakdown in price action. The line in the sand appears to be that 20 MA that the market doesn't want to let go of.... not just yet as the Midterm elections are early next week with FOMC meeting.

Lets analysis tomorrow...

The Market mover will be the GDP number.
This is a trick situation, lets look at 3 scenarios.

Better than expectations: Good news the economy is recovering, Bad news how can the FED justify the injection of potentially 1 trillion (range from 500 billion to 2 trillion likely), More bad news, the market has already priced a massive amount of the potential QE2 into the markets already.

Worst than expectations: Bad News stimulus QE1, QE-Lite have been failures, should we attempt to do the exact same thing and progress with QE2? Markets will be forced to sell off in this case, this results in QE2 being forced to be massive, this risks a continued currency war as emerging nations realize that they have to combat the falling USD.

Exactly what the market expected: This to me is the only viable option.  However since this GDP number has been revised lower 2-3 times it is a wonder how coming in at expectations is a good thing.  But at least it will not be a major factor in the determination of the amount for QE2

Fed asks primary dealers (banks) to estimate size impact of debt purchases (QE2)
"The amounts dealers chose from were zero, $250 billion, $500 billion and $1 trillion"


An update on my options position in Ciena.
The arrows point to the days that I purchased options.  First time price was around 15.75ish and the second time was when we bounced up to test the 50 MA.  I expected the stock not to be able to recapture this remaining level of support and today was proof that picking up more options at that pivot high was a good call.  We will see how the next few weeks play out however, unless massive QE2 is announced making every market and stock rally on free liquidity then I think a likely target for this stock is $12.50 market initially and then I will gauge how it reacts to this level (bottom of a massive triangle).


Sunday, October 24, 2010

QE2 = manipulation, market update

There are some interesting results that came out of the G20 meeting however nothing very concrete.

German Economic Minister Rainer Bruederle said: "An excessive increase in (the quantity of) money to me represents indirect manipulation,"  Article
This now lays the foundation for other countries to jump on this bandwagon.  However, it will all be in vein as I don't think the US cares to listen to international pressures.  Not just the US, but other countries like Japan mentioned that they will take necessary action if it is required.

One very vague statement from G20 meeting attempted to calm the potential currency war:
The G-20 agreed to “move towards more market-determined exchange-rate systems that reflect underlying economic fundamentals and refrain from competitive devaluation of currencies," Article

With the pressure from the international community mounting on both China and the US it will be very interesting to see how QE2 goes down.  

If they do announce a massive asset purchase program there is no doubt that the countries most hurt by this, emerging nations, will have to take serious steps to curb the rapid appreciation of their currencies. 


The US' subtle admission of flawed policies
I mentioned that i would post my article when it was completed.  It brings up an important point that is extremely relevant today. 

Front page bottom right


I will not recap the history here, but one thing is clear, with the US attempting move the world towards more balanced trade accounts, it appears that this policy is exactly what they struck down at the Bretton Wood conference.  As you can read, John Keynes proposed a system with this very ability to ensure that countries run a balanced trade account. 


From what I see the US doing right now is that they are attempting to quickly reverse their trade deficit by devaluing the USD to bring more manufacturing jobs back to the US.  This is in theory the "right" thing to do however, they are hurting everyone else in the process.  China's peg was very clever because they apparently knew that the US was planning on doing these mass devaluations and realized that the only way to keep exporting is to peg the Yuan.  I say Well played China, since this policy is a thorn in the side of the US because they don't have the flexibility as they hoped.  


What I find very interesting is the fact that the population of the US are so opposed to Taxes but apparently don't care that their dollar has been and will continue to be devalued meaning that even though they have the same number of dollars the purchasing power of those dollars falls. 


As you can see since the May Flash crash, the dollar has been hammered.  The US in my opinion now realizes it doesn't want "world reserve status" since it causes a demand for the dollar every time there is a crisis or market instability.  Which means right now they are concerned about ensuring the markets do not fall resulting in people not demanding the dollar as a "safe haven" which in turn results in more exports due to the low dollar.


What does this mean for the next 2 weeks, well Mid-term elections are coming Nov 2, as well as the FOMC meeting that should announce QE2.  Remember since the market expect QE2 then, a large portion of QE2 has been priced into the markets, if the US heed to the emerging markets calls for less devaluation of the USD then QE2 amount will disappoint the markets resulting in a correction.  If the US does a mass 2 Trillion (for example) QE, then we will see the international community turn on the US as a currency manipulator.  I believe that the US doesn't want to shoot itself in the foot just yet, so QE2 will be less than expected in the markets however they will use language to reassure the markets that more will occur if required.  


Notice on the UUP (dollar index) chart above 4 days ago the massive increase in the USD.  This was directly caused by a Chinese rate hike as the two economies are pegged to each other.  As one of the largest bond holders of US bonds it seems that China does not have an interest in seeing the USD plummet as it would result in a loss for China in purchasing power.  Ironically it seems that the interests of the US consumer and the Chinese government are aligned.

Ciena update 

    
Ciena unlike the overall markets just looks like it is in free fall. After breaking the 50MA it never had a chance to get back over it.  The price closed on Friday at $13.80  below my put options strike price.  The reason i believe the stock is chopping sideways is the Bollinger band.  The theory states that the price action will remain within the bands 95% of the time (2 STD) thus buying above the Bollinger band or selling below the Bollinger band doesn't make any sense as you have 2.5% chance of the market continuing in direction of your trade.  Now that the price action is within the bands again one could expect more downside  or even a retest of the 50 MA which i do expect to hold. 

S&P 500


The final chart I will go over is the S&P 500, I wanted to include the May flash crash again as a bottom scenario however it is impossible to predict another violent move.  It is just interesting that the patterns continue to hold as it appears we are on our way to make a final push higher before a breakdown.  Looking at the volume recently the past 3 positive days have resulted in diminishing buy volume.  I do expect a slight push higher but we could start seeing strong selling as early as Thursday or Friday.  The major line to watch is the  20 MA, once it is pierced, the market pressures will force a correction with support I think at the 200 MA which would be a logical place to see a correction.  If the selling is orderly with the bottom having strong buying volume i will consider going long the market, however, I will probably stick with gold / silver plays and maybe some Chinese tech stocks.


Above is a weekly of the S&P 500, I just wanted to note a logical top of this rally would be the 1950 level +/- a couple of points.  As this is the 200 MA, which was also the top in previous rally in May.  


The most interesting thing that has occurred since Oct 19th (UUP increase/Market break down) is that gold and silver have not recovered but the markets have.  Next week will be interesting but the following week with the midterm elections and FOMC meeting will be the major week to watch.


Lastly Fastest decline in home values since mid 2009
Might be a prelude to the upcoming housing numbers this week.

Wednesday, October 20, 2010

S&P up gold relativelly flat

Just wanted to bring to your attention the following.  An identical pattern is forming and the ADX and MACD are following the same patterns.

I have been out of the market until today and picked up some Oil using HOD at 9.14.  with a loose stop.

Gold did not rebound today, so it will be interesting to see how it behaves over the next 1-2 weeks.

Ciena was still weak.  The stock is still stuck under the 50 MA.

Again the importance of trendline analysis.  The 50 MA would be a very good scalp trade to the downside.

Tuesday, October 19, 2010

Market update & Ciena break down

Short post as I have an exam tomorrow I haven't really concentrated on.

I will start with Ciena to demonstrate how Technical Analysis is useful and especially for explanations why prices day to day act the way they do.
Now, I am a believer in Technical Analysis however, looking over my previous posts I always attempt to justify my TA reasoning with Fundamentals as I believe both are extremely important.

So lets start with the trade I made.  As I don't have the best Broker shorting specific stocks are not an option as they don't have the inventory of them.  So I use inverse ETF for indexes / commodities or Put Options for stocks.

Why did I purchase my Put Option on Oct 5th?
Well the technicals told me to. (Not shown but accessible here )

First sell signal was a MACD cross over.  this happens when the MACD line crosses below the signal line.
This indicates momentum has reversed.
Second sell signal is that the Slow stochastics broke below the 80 level after been embedded for a few weeks.  This indicates that momentum has shifted and the stock is overbought.

Now comes the confirmation, the sell volume started to pick up.  The first day should be signal enough to turn short on this given the fundamentals. 

Speaking of fundamentals an announcement that they were taking on more debt started to complete collapse.  One could argue that the stock may not have rolled over if that announcement was not made.  I agree and honestly expected a longer timeframe for the pull back we have seen however the sell signals gave an appropriate entry.  Entering long at that point would be foolish and the probably with following fundamentals only is that you are shooting blind for entry and exits as you are not paying attention to the current price action.

Regardless look at how POWERFUL moving averages can be.  Since this type of action happens so often it is again foolish to cast moving averages as witchcraft or voodoo.

Lets see what happen.  At the 20 MA a gap down occurred the following day on strong volume (confirmation of the move, since "smart money" was willing to be on the short side of the market).  A logical place to stop would be the 200 MA.  That day we broke below it however last part of the day we see that it just managed to close above it and where did it bounce off?  The 50 MA almost perfectly.  Now part of trend analysis is that pierced trend lines will generally break down.  That means that on the day we pierced the 200 MA the damage was down and since there was strong volume on the move one should look for a shorting opportunity.  That came on the marginal up day that follow which is expected since 200 MA is a powerful trend line.  Now other people state that the best way to break a moving average or trend line is a gap on strong volume.   Look where the gap started right on the 50 MA and the break down continued to the downside.   As of now, there is very litter support under this stock, the purple line at 12.50ish is a triangle I have drawn in and I am looking for a possible bounce off that.


Now the over all markets


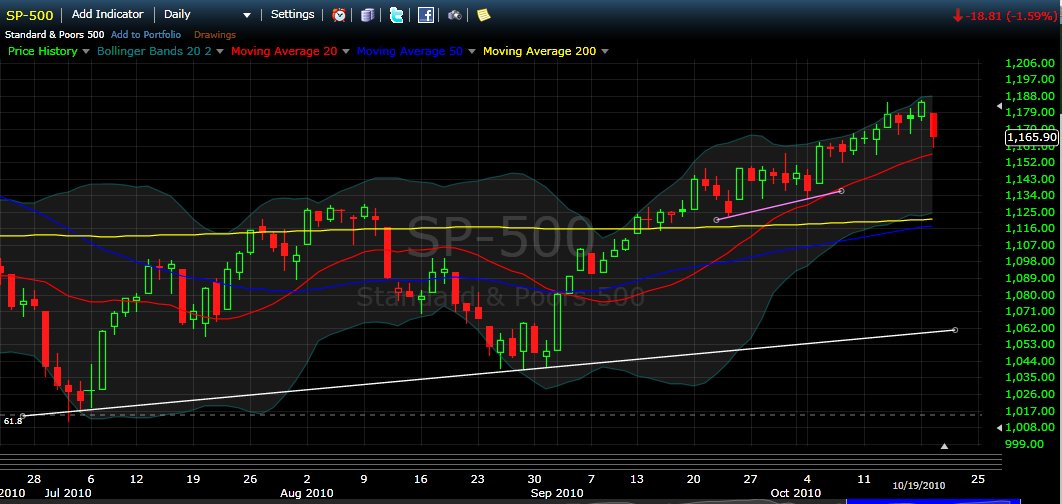
I have been pretty bearish and I can't claim that this is going to be the massive breakdown I believe is coming (similar to flash crash) however, what is happening is the same as the Ciena stock.  The MACD has crossed over today, the ADX appears that is will cross this week, the Slow stoch appears as if it will fall below the 80 level this week.  These, of course, do not have to signal anything however when 3-4 signals are screaming sell plus volume behind this move was strong then you have to take a step back as say .... should I be going long?  if you don't believe the markets are going to crash then stay neutral until things stabilize.


Two things to note however, Monday night there was a mini flash crash on SPY ETF which is one of the most traded stocks.  This ETF in less than a minute dropped 10%..... This type of action doesn't make sense in an efficient market. Of course the price quickly came back and 50 billion worth of trades was canceled.  This brings another question, does canceled trades make sense in a "free market"? That discussion I will leave for a article I am planning on writing.

Second thing to note is the POMO which are Fed bond purchases.  These happen on Monday , Wednesday and Friday.  Last Friday the markets looked like they were about to roll over and Monday was one of the largest POMO purchases in recent months at 6.3 billion "free money" in the system.  This, of course, pumped the market up.  Today there was no purchases and look what happened.  Tomorrow there is bond purchases so I 100% expect a rally tomorrow unless the invisible hand finally over powers this unsustainable rally.  I think a bounce is likely and I will at the end of the day hopefully pick up some shorts as thursday I expect another day like today.  The big line to watch is the 20 MA breaks below that virtually promise a test of the 200/50 MA exactly like Ciena's case.  Stay tuned for this bumpy ride.  I am currently sitting mostly in cash as I didn't get any entries today, a Gap down in HOD by passed my buy limit. 

Last note is mining stocks, they rally hard and get crushed hard.  One of my favorite stocks SBB is down 18% in 3 days.  This is obviously due to gold dropping 30+ dollars as the USD has rallied.  Which as everyone the USD suppression due to the POMOs have been the reason markets and commodities are rallying.  Looking for a top in this market will provide an amazing entry to gold / silver plays in the future however this could be days, weeks, months away. 

Thursday, October 14, 2010

CIENA update


Just a quick note on the CIENA chart.
Position: Put options at 14 strike price for November, purchases on Oct 5th.

The stock has had 3 days down on relatively strong volume.  A news article that is the likely reason for this sell off is Ciena Prices 320-Million 3.75% Convertible Notes

Why such a negative reaction?

I believe the reasoning is the massive amount of debt the company has been taking on.
From their Q3 balance statement we have the following

Convertible notes payable (debt)

October 2009..............798,000,000
July 2010 ....................1,174,580,000

Total stockholders' equity


October 2009..............455,838,000
July 2010 ....................228,295,000

This debt increase has occurred BEFORE the addition $320 million was announced a few days back.


The following information was taken from : Yahoo Finance
It is the entire communication Equipment industry ranked by LT debt to equity and guess who is topping the chart?

It is clear that Ciena is over leveraged and currently requires debt to finance its current debt obligations.

And one technical that has produced a Sell signal is the ADX as the DI- line has crossed the DI+ line today.  The ADX line which shows trend strength is above the 25 indicating a strong trend.


Monday, October 11, 2010

Oil entry and CIENA


I entered a position in oil a couple days back at the purple line in the chart above.  The Stop would be above the cyan line as it is above the a previous high. I am using an ETF HOD by Horizon BetaPro.

The MACD histogram is rolling over in oil, indicating that momentum is fading.  Watch for a cross of the MACD line for confirmation of a sell signal.

The Slow Stochastics has failed to embed and fell below the 80 line today. This signals the momentum is down.  The next quality buy opportunity would be when the yellow line gets below the 20 line and breaks above it as it did the last week in August.

I have a horizontal trend line that I believe will be retested within a month or so.  The other trend line I believe if broke will result into a move down to 72-73 level.


I would like to point out a bearish divergence on CIEN.  This indicates that the momentum has shifted bearish however, price action is still remaining neutral to bullish.  It is then expected for price action to drop at least to 14.88.   In addition the top trend line was put in at the beginning of October and has again came into play today when the price retreated after touching it.  The candle stick formation is again a shooting star which is a sell signal.  Confirmation tomorrow would indicate a reversal on this stock.   It appears that the 20 MA is providing support and the trend line sloping down is the resistance.  This stock has to break out of this within the week.


Well technicals proved to be correct on Ciena. it broke down today and as of 11:30, A bear flag pattern has been created.  I would expect a break down unless the markets magically surge on no news which seems to be the norm.  The news article that caused Ciena's gap down was the issuance of new debt.