To see Oct 26 market review click here.
I want to show a graph of the correlation between S&P 500 and the AUDUSD pair.
From this it is pretty clear that they are highly correlated. The way this currency pair works is that you would buy AUD and sell USD. So if the AUD becomes more valued versus the USD the price goes up. If there is strength in the dollar for example, the price will decline.
Below is the Currency pair and look at how the price action mirrors the current S&P 500.
The was a VERY strong break down today. This was due to Australian CPI information that came out, see Article. As I am not a forex trader and just began to look into currency pairs because of the currency war brewing, I will point to this article that explains the drop in the pair, see Article. Basically a CPI of 0.6% vs a 0.7% expectation resulted in a quick reversal that started at 8:35 pm EST.
Great thing about techincals is that the analysis is the same for any chart pattern. We have momentum from MACD and slow stoch pointing down, a cross on the AXR, the DI- crossed above the DI+ which is a bearish cross over and to finish it all off we broke the 20 day MA.
This, therefore, based on the correlation should imply a drop in the S&P 500 tomorrow. The reasoning is obviously the correlation as demonstrated above but it is the strengthening of the dollar that was pointed to in the previous post (Oct 26).
The Asian markets also at this time had a sharp sell off on the strengthening of the USD in addition the Future market has priced in a 5 point drop so far in the S&P 500 tomorrow.
Stay tuned....
Trading thoughts and ideas
Analysis of a wide range of stock, commodities and FOREX charts.
Specialized in gold and silver small-mid cap mining companies.
Wednesday, October 27, 2010
Tuesday, October 26, 2010
Volume today: SPY and volume
For some reason the index data only has daily volume compared to stocks that have 1 minute volume. I am using an ETF that tracks the S&P 500 called SPY.
I was interested in seeing how the volume was today. Strong selling in the morning with mostly selling second half of the day with the exception of the last 5 minutes. This strong sell volume seemed to have a mandate to close today in the green. Well played bulls.
Below is the S&P 500.
Yesterday we had a Bearish Gravestone Doji
Today we have a Bearish Dragon Fly Doji
MACD: The histogram had a larger negative tick today, meaning that the distance between the MACD line and Signal line are diverging. This signals a momentum shift towards the bear side.
Slow Stoch: As expected once the 80 level was broken the Slow Stoch has had a hard time getting back over it. This means that the market is currently overbought.
All signals point to a breakdown however with more POMO, occurring Thursday then Mon/Wed/Fri next week, this market could continue to drift up to sideways. What is really on peoples minds is Nov 2-3 FOMC meeting where QE2 announcement is likely to communicated. The market has priced in alot of QE2 already so the FED would have to have a massive injection or miss market expectation with the intent to allow the market to correct, before announcing additional QE measures. The language will be important when the meeting announcement comes out.
Also Mid-term elections are on November 2nd as well.
-------------------------------------------------------
Update: Vix
So... VIX runs opposite to the overall markets. Up in the VIX should result in a down in the stock markets. In two days, the VIX is almost up 8% as the S&P 500 have stayed basically flat. With this change in the Vix, all indicators and volume confirming bearish behaviour, I will reaffirm my previous call yesterday that I believe monday was our turn date and the high will not be taken out. There is always a but.... the GDP numbers coming this friday and QE2 / Elections next week it seems that anything could happen. These are massive events that could shape the next few months of economic activity.
------------------------------------------------------------
Update 2: Dollar index
On the 19th I mentioned that the spike in the dollar index was a result of China's unexpected rate hike. Today we have seen a similar spike, with no real news story backing it. The fact that the 19th broke the trend line and today we have retested and broke above it again indicates that a potential bottom in the dollar index has been reached. The Dollar has moved in the opposite direction to the overall markets as seen here.
A bottom in UUP would be bearish for the markets, but the FED QE2 talk has been hammering the Dollar over the past 2 months.
I was interested in seeing how the volume was today. Strong selling in the morning with mostly selling second half of the day with the exception of the last 5 minutes. This strong sell volume seemed to have a mandate to close today in the green. Well played bulls.
Below is the S&P 500.
Yesterday we had a Bearish Gravestone Doji
Today we have a Bearish Dragon Fly Doji
MACD: The histogram had a larger negative tick today, meaning that the distance between the MACD line and Signal line are diverging. This signals a momentum shift towards the bear side.
Slow Stoch: As expected once the 80 level was broken the Slow Stoch has had a hard time getting back over it. This means that the market is currently overbought.
All signals point to a breakdown however with more POMO, occurring Thursday then Mon/Wed/Fri next week, this market could continue to drift up to sideways. What is really on peoples minds is Nov 2-3 FOMC meeting where QE2 announcement is likely to communicated. The market has priced in alot of QE2 already so the FED would have to have a massive injection or miss market expectation with the intent to allow the market to correct, before announcing additional QE measures. The language will be important when the meeting announcement comes out.
Also Mid-term elections are on November 2nd as well.
-------------------------------------------------------
Update: Vix
So... VIX runs opposite to the overall markets. Up in the VIX should result in a down in the stock markets. In two days, the VIX is almost up 8% as the S&P 500 have stayed basically flat. With this change in the Vix, all indicators and volume confirming bearish behaviour, I will reaffirm my previous call yesterday that I believe monday was our turn date and the high will not be taken out. There is always a but.... the GDP numbers coming this friday and QE2 / Elections next week it seems that anything could happen. These are massive events that could shape the next few months of economic activity.
------------------------------------------------------------
Update 2: Dollar index
On the 19th I mentioned that the spike in the dollar index was a result of China's unexpected rate hike. Today we have seen a similar spike, with no real news story backing it. The fact that the 19th broke the trend line and today we have retested and broke above it again indicates that a potential bottom in the dollar index has been reached. The Dollar has moved in the opposite direction to the overall markets as seen here.
A bottom in UUP would be bearish for the markets, but the FED QE2 talk has been hammering the Dollar over the past 2 months.
Monday, October 25, 2010
S&P 500 October 25th note
As expected, markets rallied to new highs today then quickly reversed in the later stages of the day. This formed a candle stick pattern called A Bearish Gravestone DOJI.
This is a reversal pattern and something that I would expect to see around this price. Confirmation tomorrow with a negative day is required however, I took a speculative oil short again. I prefer not to trade oil however, I haven't found an etf with the same liquidity for the overall markets in Canada. However, I might start looking into some listed on of the NYSE such as SDS.
Another note is that the slow stoch has again fallen out of the 80 level. This is continuing to signal that this uptrend requires a pull back to correct the overbought condition.
This action has done exactly as I expected and this week I do expect to see a substantial reversal, however, from that reversal will be an up leg that will fail to make a new high resulting in a bear market for the next month or so. The only caveat to this is what will happen Nov 2nd with both the midterm elections and the FOMC meeting. I do expect QE2 to be announced however with much reserved language and not the @1.5 - 2.5 trillion that I think many are expecting. The market has priced so much QE2 in that the boost has already been realized and hence no need to actually follow through with the amount expected. I believe the markets will be allowed to correct however they will be pumped up again with more QE2.1 talk.
Remember that the US are not in a bubble and international pressures will continually mount against them. In addition to this, once the people in the States realize that prices have started to go up substantially due to the devalued dollar they will start to mount pressure as well.
This will be an interesting conclusion to the year and everyone with a computer has front row tickets.
Sunday, October 24, 2010
QE2 = manipulation, market update
There are some interesting results that came out of the G20 meeting however nothing very concrete.
German Economic Minister Rainer Bruederle said: "An excessive increase in (the quantity of) money to me represents indirect manipulation," Article
This now lays the foundation for other countries to jump on this bandwagon. However, it will all be in vein as I don't think the US cares to listen to international pressures. Not just the US, but other countries like Japan mentioned that they will take necessary action if it is required.
One very vague statement from G20 meeting attempted to calm the potential currency war:
The G-20 agreed to “move towards more market-determined exchange-rate systems that reflect underlying economic fundamentals and refrain from competitive devaluation of currencies," Article
With the pressure from the international community mounting on both China and the US it will be very interesting to see how QE2 goes down.
If they do announce a massive asset purchase program there is no doubt that the countries most hurt by this, emerging nations, will have to take serious steps to curb the rapid appreciation of their currencies.
The US' subtle admission of flawed policies
I mentioned that i would post my article when it was completed. It brings up an important point that is extremely relevant today.
Front page bottom right
I will not recap the history here, but one thing is clear, with the US attempting move the world towards more balanced trade accounts, it appears that this policy is exactly what they struck down at the Bretton Wood conference. As you can read, John Keynes proposed a system with this very ability to ensure that countries run a balanced trade account.
From what I see the US doing right now is that they are attempting to quickly reverse their trade deficit by devaluing the USD to bring more manufacturing jobs back to the US. This is in theory the "right" thing to do however, they are hurting everyone else in the process. China's peg was very clever because they apparently knew that the US was planning on doing these mass devaluations and realized that the only way to keep exporting is to peg the Yuan. I say Well played China, since this policy is a thorn in the side of the US because they don't have the flexibility as they hoped.
What I find very interesting is the fact that the population of the US are so opposed to Taxes but apparently don't care that their dollar has been and will continue to be devalued meaning that even though they have the same number of dollars the purchasing power of those dollars falls.
As you can see since the May Flash crash, the dollar has been hammered. The US in my opinion now realizes it doesn't want "world reserve status" since it causes a demand for the dollar every time there is a crisis or market instability. Which means right now they are concerned about ensuring the markets do not fall resulting in people not demanding the dollar as a "safe haven" which in turn results in more exports due to the low dollar.
What does this mean for the next 2 weeks, well Mid-term elections are coming Nov 2, as well as the FOMC meeting that should announce QE2. Remember since the market expect QE2 then, a large portion of QE2 has been priced into the markets, if the US heed to the emerging markets calls for less devaluation of the USD then QE2 amount will disappoint the markets resulting in a correction. If the US does a mass 2 Trillion (for example) QE, then we will see the international community turn on the US as a currency manipulator. I believe that the US doesn't want to shoot itself in the foot just yet, so QE2 will be less than expected in the markets however they will use language to reassure the markets that more will occur if required.
Notice on the UUP (dollar index) chart above 4 days ago the massive increase in the USD. This was directly caused by a Chinese rate hike as the two economies are pegged to each other. As one of the largest bond holders of US bonds it seems that China does not have an interest in seeing the USD plummet as it would result in a loss for China in purchasing power. Ironically it seems that the interests of the US consumer and the Chinese government are aligned.
Ciena update
Ciena unlike the overall markets just looks like it is in free fall. After breaking the 50MA it never had a chance to get back over it. The price closed on Friday at $13.80 below my put options strike price. The reason i believe the stock is chopping sideways is the Bollinger band. The theory states that the price action will remain within the bands 95% of the time (2 STD) thus buying above the Bollinger band or selling below the Bollinger band doesn't make any sense as you have 2.5% chance of the market continuing in direction of your trade. Now that the price action is within the bands again one could expect more downside or even a retest of the 50 MA which i do expect to hold.
S&P 500
The final chart I will go over is the S&P 500, I wanted to include the May flash crash again as a bottom scenario however it is impossible to predict another violent move. It is just interesting that the patterns continue to hold as it appears we are on our way to make a final push higher before a breakdown. Looking at the volume recently the past 3 positive days have resulted in diminishing buy volume. I do expect a slight push higher but we could start seeing strong selling as early as Thursday or Friday. The major line to watch is the 20 MA, once it is pierced, the market pressures will force a correction with support I think at the 200 MA which would be a logical place to see a correction. If the selling is orderly with the bottom having strong buying volume i will consider going long the market, however, I will probably stick with gold / silver plays and maybe some Chinese tech stocks.
Above is a weekly of the S&P 500, I just wanted to note a logical top of this rally would be the 1950 level +/- a couple of points. As this is the 200 MA, which was also the top in previous rally in May.
The most interesting thing that has occurred since Oct 19th (UUP increase/Market break down) is that gold and silver have not recovered but the markets have. Next week will be interesting but the following week with the midterm elections and FOMC meeting will be the major week to watch.
Lastly Fastest decline in home values since mid 2009
Might be a prelude to the upcoming housing numbers this week.
German Economic Minister Rainer Bruederle said: "An excessive increase in (the quantity of) money to me represents indirect manipulation," Article
This now lays the foundation for other countries to jump on this bandwagon. However, it will all be in vein as I don't think the US cares to listen to international pressures. Not just the US, but other countries like Japan mentioned that they will take necessary action if it is required.
One very vague statement from G20 meeting attempted to calm the potential currency war:
The G-20 agreed to “move towards more market-determined exchange-rate systems that reflect underlying economic fundamentals and refrain from competitive devaluation of currencies," Article
With the pressure from the international community mounting on both China and the US it will be very interesting to see how QE2 goes down.
If they do announce a massive asset purchase program there is no doubt that the countries most hurt by this, emerging nations, will have to take serious steps to curb the rapid appreciation of their currencies.
The US' subtle admission of flawed policies
I mentioned that i would post my article when it was completed. It brings up an important point that is extremely relevant today.
Front page bottom right
I will not recap the history here, but one thing is clear, with the US attempting move the world towards more balanced trade accounts, it appears that this policy is exactly what they struck down at the Bretton Wood conference. As you can read, John Keynes proposed a system with this very ability to ensure that countries run a balanced trade account.
From what I see the US doing right now is that they are attempting to quickly reverse their trade deficit by devaluing the USD to bring more manufacturing jobs back to the US. This is in theory the "right" thing to do however, they are hurting everyone else in the process. China's peg was very clever because they apparently knew that the US was planning on doing these mass devaluations and realized that the only way to keep exporting is to peg the Yuan. I say Well played China, since this policy is a thorn in the side of the US because they don't have the flexibility as they hoped.
What I find very interesting is the fact that the population of the US are so opposed to Taxes but apparently don't care that their dollar has been and will continue to be devalued meaning that even though they have the same number of dollars the purchasing power of those dollars falls.
As you can see since the May Flash crash, the dollar has been hammered. The US in my opinion now realizes it doesn't want "world reserve status" since it causes a demand for the dollar every time there is a crisis or market instability. Which means right now they are concerned about ensuring the markets do not fall resulting in people not demanding the dollar as a "safe haven" which in turn results in more exports due to the low dollar.
What does this mean for the next 2 weeks, well Mid-term elections are coming Nov 2, as well as the FOMC meeting that should announce QE2. Remember since the market expect QE2 then, a large portion of QE2 has been priced into the markets, if the US heed to the emerging markets calls for less devaluation of the USD then QE2 amount will disappoint the markets resulting in a correction. If the US does a mass 2 Trillion (for example) QE, then we will see the international community turn on the US as a currency manipulator. I believe that the US doesn't want to shoot itself in the foot just yet, so QE2 will be less than expected in the markets however they will use language to reassure the markets that more will occur if required.
Notice on the UUP (dollar index) chart above 4 days ago the massive increase in the USD. This was directly caused by a Chinese rate hike as the two economies are pegged to each other. As one of the largest bond holders of US bonds it seems that China does not have an interest in seeing the USD plummet as it would result in a loss for China in purchasing power. Ironically it seems that the interests of the US consumer and the Chinese government are aligned.
Ciena update
Ciena unlike the overall markets just looks like it is in free fall. After breaking the 50MA it never had a chance to get back over it. The price closed on Friday at $13.80 below my put options strike price. The reason i believe the stock is chopping sideways is the Bollinger band. The theory states that the price action will remain within the bands 95% of the time (2 STD) thus buying above the Bollinger band or selling below the Bollinger band doesn't make any sense as you have 2.5% chance of the market continuing in direction of your trade. Now that the price action is within the bands again one could expect more downside or even a retest of the 50 MA which i do expect to hold.
S&P 500
The final chart I will go over is the S&P 500, I wanted to include the May flash crash again as a bottom scenario however it is impossible to predict another violent move. It is just interesting that the patterns continue to hold as it appears we are on our way to make a final push higher before a breakdown. Looking at the volume recently the past 3 positive days have resulted in diminishing buy volume. I do expect a slight push higher but we could start seeing strong selling as early as Thursday or Friday. The major line to watch is the 20 MA, once it is pierced, the market pressures will force a correction with support I think at the 200 MA which would be a logical place to see a correction. If the selling is orderly with the bottom having strong buying volume i will consider going long the market, however, I will probably stick with gold / silver plays and maybe some Chinese tech stocks.
Above is a weekly of the S&P 500, I just wanted to note a logical top of this rally would be the 1950 level +/- a couple of points. As this is the 200 MA, which was also the top in previous rally in May.
The most interesting thing that has occurred since Oct 19th (UUP increase/Market break down) is that gold and silver have not recovered but the markets have. Next week will be interesting but the following week with the midterm elections and FOMC meeting will be the major week to watch.
Lastly Fastest decline in home values since mid 2009
Might be a prelude to the upcoming housing numbers this week.
Labels:
CIEN
Wednesday, October 20, 2010
S&P up gold relativelly flat
Just wanted to bring to your attention the following. An identical pattern is forming and the ADX and MACD are following the same patterns.
I have been out of the market until today and picked up some Oil using HOD at 9.14. with a loose stop.
Gold did not rebound today, so it will be interesting to see how it behaves over the next 1-2 weeks.
Ciena was still weak. The stock is still stuck under the 50 MA.
Again the importance of trendline analysis. The 50 MA would be a very good scalp trade to the downside.
I have been out of the market until today and picked up some Oil using HOD at 9.14. with a loose stop.
Gold did not rebound today, so it will be interesting to see how it behaves over the next 1-2 weeks.
Ciena was still weak. The stock is still stuck under the 50 MA.
Again the importance of trendline analysis. The 50 MA would be a very good scalp trade to the downside.
Labels:
CIEN
Tuesday, October 19, 2010
Market update & Ciena break down
Short post as I have an exam tomorrow I haven't really concentrated on.
I will start with Ciena to demonstrate how Technical Analysis is useful and especially for explanations why prices day to day act the way they do.
Now, I am a believer in Technical Analysis however, looking over my previous posts I always attempt to justify my TA reasoning with Fundamentals as I believe both are extremely important.
So lets start with the trade I made. As I don't have the best Broker shorting specific stocks are not an option as they don't have the inventory of them. So I use inverse ETF for indexes / commodities or Put Options for stocks.
Why did I purchase my Put Option on Oct 5th?
Well the technicals told me to. (Not shown but accessible here )
First sell signal was a MACD cross over. this happens when the MACD line crosses below the signal line.
This indicates momentum has reversed.
Second sell signal is that the Slow stochastics broke below the 80 level after been embedded for a few weeks. This indicates that momentum has shifted and the stock is overbought.
Now comes the confirmation, the sell volume started to pick up. The first day should be signal enough to turn short on this given the fundamentals.
Speaking of fundamentals an announcement that they were taking on more debt started to complete collapse. One could argue that the stock may not have rolled over if that announcement was not made. I agree and honestly expected a longer timeframe for the pull back we have seen however the sell signals gave an appropriate entry. Entering long at that point would be foolish and the probably with following fundamentals only is that you are shooting blind for entry and exits as you are not paying attention to the current price action.
Regardless look at how POWERFUL moving averages can be. Since this type of action happens so often it is again foolish to cast moving averages as witchcraft or voodoo.
Lets see what happen. At the 20 MA a gap down occurred the following day on strong volume (confirmation of the move, since "smart money" was willing to be on the short side of the market). A logical place to stop would be the 200 MA. That day we broke below it however last part of the day we see that it just managed to close above it and where did it bounce off? The 50 MA almost perfectly. Now part of trend analysis is that pierced trend lines will generally break down. That means that on the day we pierced the 200 MA the damage was down and since there was strong volume on the move one should look for a shorting opportunity. That came on the marginal up day that follow which is expected since 200 MA is a powerful trend line. Now other people state that the best way to break a moving average or trend line is a gap on strong volume. Look where the gap started right on the 50 MA and the break down continued to the downside. As of now, there is very litter support under this stock, the purple line at 12.50ish is a triangle I have drawn in and I am looking for a possible bounce off that.
Now the over all markets
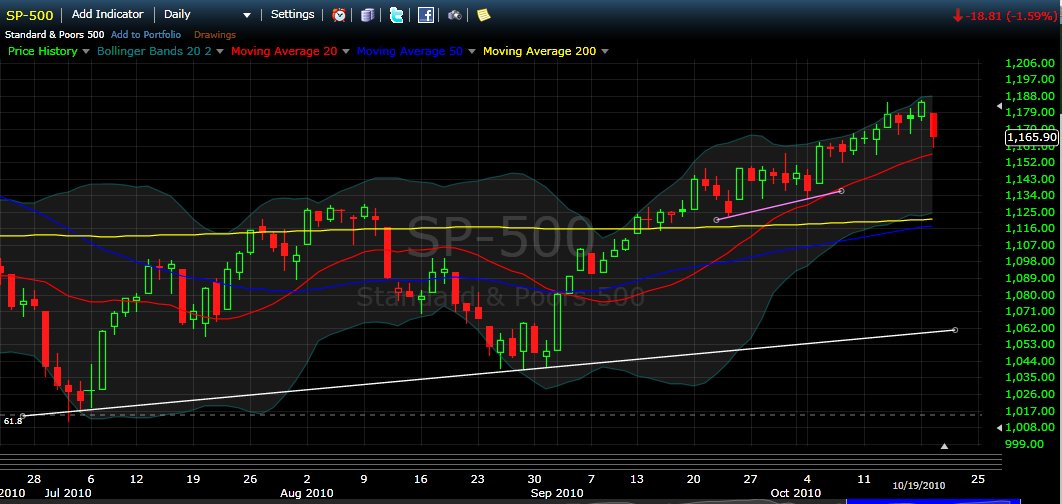
I have been pretty bearish and I can't claim that this is going to be the massive breakdown I believe is coming (similar to flash crash) however, what is happening is the same as the Ciena stock. The MACD has crossed over today, the ADX appears that is will cross this week, the Slow stoch appears as if it will fall below the 80 level this week. These, of course, do not have to signal anything however when 3-4 signals are screaming sell plus volume behind this move was strong then you have to take a step back as say .... should I be going long? if you don't believe the markets are going to crash then stay neutral until things stabilize.
Two things to note however, Monday night there was a mini flash crash on SPY ETF which is one of the most traded stocks. This ETF in less than a minute dropped 10%..... This type of action doesn't make sense in an efficient market. Of course the price quickly came back and 50 billion worth of trades was canceled. This brings another question, does canceled trades make sense in a "free market"? That discussion I will leave for a article I am planning on writing.
Second thing to note is the POMO which are Fed bond purchases. These happen on Monday , Wednesday and Friday. Last Friday the markets looked like they were about to roll over and Monday was one of the largest POMO purchases in recent months at 6.3 billion "free money" in the system. This, of course, pumped the market up. Today there was no purchases and look what happened. Tomorrow there is bond purchases so I 100% expect a rally tomorrow unless the invisible hand finally over powers this unsustainable rally. I think a bounce is likely and I will at the end of the day hopefully pick up some shorts as thursday I expect another day like today. The big line to watch is the 20 MA breaks below that virtually promise a test of the 200/50 MA exactly like Ciena's case. Stay tuned for this bumpy ride. I am currently sitting mostly in cash as I didn't get any entries today, a Gap down in HOD by passed my buy limit.
Last note is mining stocks, they rally hard and get crushed hard. One of my favorite stocks SBB is down 18% in 3 days. This is obviously due to gold dropping 30+ dollars as the USD has rallied. Which as everyone the USD suppression due to the POMOs have been the reason markets and commodities are rallying. Looking for a top in this market will provide an amazing entry to gold / silver plays in the future however this could be days, weeks, months away.
I will start with Ciena to demonstrate how Technical Analysis is useful and especially for explanations why prices day to day act the way they do.
Now, I am a believer in Technical Analysis however, looking over my previous posts I always attempt to justify my TA reasoning with Fundamentals as I believe both are extremely important.
So lets start with the trade I made. As I don't have the best Broker shorting specific stocks are not an option as they don't have the inventory of them. So I use inverse ETF for indexes / commodities or Put Options for stocks.
Why did I purchase my Put Option on Oct 5th?
Well the technicals told me to. (Not shown but accessible here )
First sell signal was a MACD cross over. this happens when the MACD line crosses below the signal line.
This indicates momentum has reversed.
Second sell signal is that the Slow stochastics broke below the 80 level after been embedded for a few weeks. This indicates that momentum has shifted and the stock is overbought.
Now comes the confirmation, the sell volume started to pick up. The first day should be signal enough to turn short on this given the fundamentals.
Speaking of fundamentals an announcement that they were taking on more debt started to complete collapse. One could argue that the stock may not have rolled over if that announcement was not made. I agree and honestly expected a longer timeframe for the pull back we have seen however the sell signals gave an appropriate entry. Entering long at that point would be foolish and the probably with following fundamentals only is that you are shooting blind for entry and exits as you are not paying attention to the current price action.
Regardless look at how POWERFUL moving averages can be. Since this type of action happens so often it is again foolish to cast moving averages as witchcraft or voodoo.
Lets see what happen. At the 20 MA a gap down occurred the following day on strong volume (confirmation of the move, since "smart money" was willing to be on the short side of the market). A logical place to stop would be the 200 MA. That day we broke below it however last part of the day we see that it just managed to close above it and where did it bounce off? The 50 MA almost perfectly. Now part of trend analysis is that pierced trend lines will generally break down. That means that on the day we pierced the 200 MA the damage was down and since there was strong volume on the move one should look for a shorting opportunity. That came on the marginal up day that follow which is expected since 200 MA is a powerful trend line. Now other people state that the best way to break a moving average or trend line is a gap on strong volume. Look where the gap started right on the 50 MA and the break down continued to the downside. As of now, there is very litter support under this stock, the purple line at 12.50ish is a triangle I have drawn in and I am looking for a possible bounce off that.
Now the over all markets
I have been pretty bearish and I can't claim that this is going to be the massive breakdown I believe is coming (similar to flash crash) however, what is happening is the same as the Ciena stock. The MACD has crossed over today, the ADX appears that is will cross this week, the Slow stoch appears as if it will fall below the 80 level this week. These, of course, do not have to signal anything however when 3-4 signals are screaming sell plus volume behind this move was strong then you have to take a step back as say .... should I be going long? if you don't believe the markets are going to crash then stay neutral until things stabilize.
Two things to note however, Monday night there was a mini flash crash on SPY ETF which is one of the most traded stocks. This ETF in less than a minute dropped 10%..... This type of action doesn't make sense in an efficient market. Of course the price quickly came back and 50 billion worth of trades was canceled. This brings another question, does canceled trades make sense in a "free market"? That discussion I will leave for a article I am planning on writing.
Second thing to note is the POMO which are Fed bond purchases. These happen on Monday , Wednesday and Friday. Last Friday the markets looked like they were about to roll over and Monday was one of the largest POMO purchases in recent months at 6.3 billion "free money" in the system. This, of course, pumped the market up. Today there was no purchases and look what happened. Tomorrow there is bond purchases so I 100% expect a rally tomorrow unless the invisible hand finally over powers this unsustainable rally. I think a bounce is likely and I will at the end of the day hopefully pick up some shorts as thursday I expect another day like today. The big line to watch is the 20 MA breaks below that virtually promise a test of the 200/50 MA exactly like Ciena's case. Stay tuned for this bumpy ride. I am currently sitting mostly in cash as I didn't get any entries today, a Gap down in HOD by passed my buy limit.
Last note is mining stocks, they rally hard and get crushed hard. One of my favorite stocks SBB is down 18% in 3 days. This is obviously due to gold dropping 30+ dollars as the USD has rallied. Which as everyone the USD suppression due to the POMOs have been the reason markets and commodities are rallying. Looking for a top in this market will provide an amazing entry to gold / silver plays in the future however this could be days, weeks, months away.
Labels:
CIEN
Sunday, October 17, 2010
Financials getting crushed and Oil turn date?
Lets start with Financials, this is FAS which is a 3x bull ETF that tracks Financial institutions in the states. The counter part of the ETF is FAZ which is a 3x bear.
Chart Link
The first thing to note about this chart is it isn't following the general market. It turned sideways at the end of september as the general market has climbed to new recent highs. I have heard some arguments that say that the general market should be following a similar trend as the fundamentals are not there to support a rally.
Speaking of fundamentals, what is happening with financial institutions? The main concern right now people are calling robosigning or mortgage gate. There are hundreds of stories out there so I will not talk about the details of this please see google news search for more information
In a nut shell, banks were foreclosing homes they techincally didn't have the right to foreclose as they didn't have the proper documentation leading to some home owners "taking the law into their own hands" by squatting in their previous owned houses. The implications are devastating as foreclosed home sales make up 1/3 of existing homes sales and they have effectively been halted until this mess is cleared up. Also think about it from a buyers perspective, there is a chance that the home you purchase may be subjected to repossession if the bank didn't technically own the house it sold to you.
Any ways that is the fundamentals behind this sideways action on FAS. Now..... Techincals are have just began to scream sell.
ADX has crossed over which is a sell signal.
MACD histogram has turned negative signaling downward momentum. And the likelihood is that the MACD line will break the 0 level by next week reinforcing the fact that momentum is to the downside.
Look at the sell volume the past 2 days, this is what you want to see as confirmation of a trend reversal.
Slow Stochastics have turned down sharply confirming momentum has shifted.
Lastly, the 20 MA was broken and resistance was found at the the 50 MA. However, the candlestick formation is a continuation pattern and with the other technicals pointing south expect the 50 MA to be broken next week as well.
The implications of this may be severe. As the general market heading higher, there is some disconnect that will be corrected. Tech stocks led the charge in the nasdaq namely Google and Apple. In addition to American Financial companies, looking at the FTSE, which tracks Europe financials, the chart pattern appears to be weakening also.
Remember what got the world into this recession, mortgage crisis and banks tanking. So be wary in the general markets. A notable stock that got hammered last week was JP Morgan in 3 days the stock went from $40.50 to $37 dollars. Friday the stock was down 4.29%
Another interesting Chart is the following plotting FAS and S&P 500. Since FAS is 3x bull of the financials it moves much faster than S&P. However look at the broken correlation. The link of the chart is below if you want to check other time frames however FAS and S&P tend to follow similar patterns. The last 2 day the market remained flat and FAS tanked. How will the market correct this correlation?
Link to chart
Chart Link
Oil has been ranging between the Cyan lines. Sometimes breaking above and other times breaking below however the range has been approximately 73- 83 since June. The USD has been getting hammered giving rise to all commodities (gold touched 1390 recently). The USD has been falling because of QE2 expectations. The currency war is being perpetuated by multiple counties and QE2 could solidify this "race to the bottom" as weak currency = stronger export sector. I find it interesting that the US has been calling out China on "currency manipulation" as it has continued to devalue its own currency to prop up its export sector. Anyways it is my belief that QE2 has been overpriced into the markets and when the announcement comes which is expected to be at the FOMC on Novemeber 2nd the market will correct.
My reasoning is simply that just the mention of QE2 has done what the FED wanted. Keep the market from collapsing. By holding back on the amount of QE, it allows for more room to navigate the next downleg in the market.
Anyways back to OIL.
Friday was strong selling a drop of 1.74%. The top of the range was hit around $83. I expect the Dollar to rally and oil to head back down into this range. However, all moving averages have are contained so strong resistance around the 77- 78 level. Breaks of these moving averages especially the 200MA will result in a retest of the lower bound.
An indication of the momentum shift is the MACD histogram which appears like it will turn negative next week. In addition, on the 11th, the Slow stoch broke the 80 line and began to head south, confirming a momentum shift is underway. A strong sell signal will be the DI- crossing the DI+ on the ADX. This appears to still be a few days away if selling continues next week.
Lastly, the purple lines are a triangle that has been formed from the highs / lows in the May flash crash. It will be interesting to see how well the price action respects this triangle going forward.
Chart Link
The first thing to note about this chart is it isn't following the general market. It turned sideways at the end of september as the general market has climbed to new recent highs. I have heard some arguments that say that the general market should be following a similar trend as the fundamentals are not there to support a rally.
Speaking of fundamentals, what is happening with financial institutions? The main concern right now people are calling robosigning or mortgage gate. There are hundreds of stories out there so I will not talk about the details of this please see google news search for more information
In a nut shell, banks were foreclosing homes they techincally didn't have the right to foreclose as they didn't have the proper documentation leading to some home owners "taking the law into their own hands" by squatting in their previous owned houses. The implications are devastating as foreclosed home sales make up 1/3 of existing homes sales and they have effectively been halted until this mess is cleared up. Also think about it from a buyers perspective, there is a chance that the home you purchase may be subjected to repossession if the bank didn't technically own the house it sold to you.
Any ways that is the fundamentals behind this sideways action on FAS. Now..... Techincals are have just began to scream sell.
ADX has crossed over which is a sell signal.
MACD histogram has turned negative signaling downward momentum. And the likelihood is that the MACD line will break the 0 level by next week reinforcing the fact that momentum is to the downside.
Look at the sell volume the past 2 days, this is what you want to see as confirmation of a trend reversal.
Slow Stochastics have turned down sharply confirming momentum has shifted.
Lastly, the 20 MA was broken and resistance was found at the the 50 MA. However, the candlestick formation is a continuation pattern and with the other technicals pointing south expect the 50 MA to be broken next week as well.
The implications of this may be severe. As the general market heading higher, there is some disconnect that will be corrected. Tech stocks led the charge in the nasdaq namely Google and Apple. In addition to American Financial companies, looking at the FTSE, which tracks Europe financials, the chart pattern appears to be weakening also.
Remember what got the world into this recession, mortgage crisis and banks tanking. So be wary in the general markets. A notable stock that got hammered last week was JP Morgan in 3 days the stock went from $40.50 to $37 dollars. Friday the stock was down 4.29%
Another interesting Chart is the following plotting FAS and S&P 500. Since FAS is 3x bull of the financials it moves much faster than S&P. However look at the broken correlation. The link of the chart is below if you want to check other time frames however FAS and S&P tend to follow similar patterns. The last 2 day the market remained flat and FAS tanked. How will the market correct this correlation?
Link to chart
Chart Link
Oil has been ranging between the Cyan lines. Sometimes breaking above and other times breaking below however the range has been approximately 73- 83 since June. The USD has been getting hammered giving rise to all commodities (gold touched 1390 recently). The USD has been falling because of QE2 expectations. The currency war is being perpetuated by multiple counties and QE2 could solidify this "race to the bottom" as weak currency = stronger export sector. I find it interesting that the US has been calling out China on "currency manipulation" as it has continued to devalue its own currency to prop up its export sector. Anyways it is my belief that QE2 has been overpriced into the markets and when the announcement comes which is expected to be at the FOMC on Novemeber 2nd the market will correct.
My reasoning is simply that just the mention of QE2 has done what the FED wanted. Keep the market from collapsing. By holding back on the amount of QE, it allows for more room to navigate the next downleg in the market.
Anyways back to OIL.
Friday was strong selling a drop of 1.74%. The top of the range was hit around $83. I expect the Dollar to rally and oil to head back down into this range. However, all moving averages have are contained so strong resistance around the 77- 78 level. Breaks of these moving averages especially the 200MA will result in a retest of the lower bound.
An indication of the momentum shift is the MACD histogram which appears like it will turn negative next week. In addition, on the 11th, the Slow stoch broke the 80 line and began to head south, confirming a momentum shift is underway. A strong sell signal will be the DI- crossing the DI+ on the ADX. This appears to still be a few days away if selling continues next week.
Lastly, the purple lines are a triangle that has been formed from the highs / lows in the May flash crash. It will be interesting to see how well the price action respects this triangle going forward.
Subscribe to:
Posts (Atom)