Market Scheming

Wednesday, October 20, 2010

S&P up gold relativelly flat

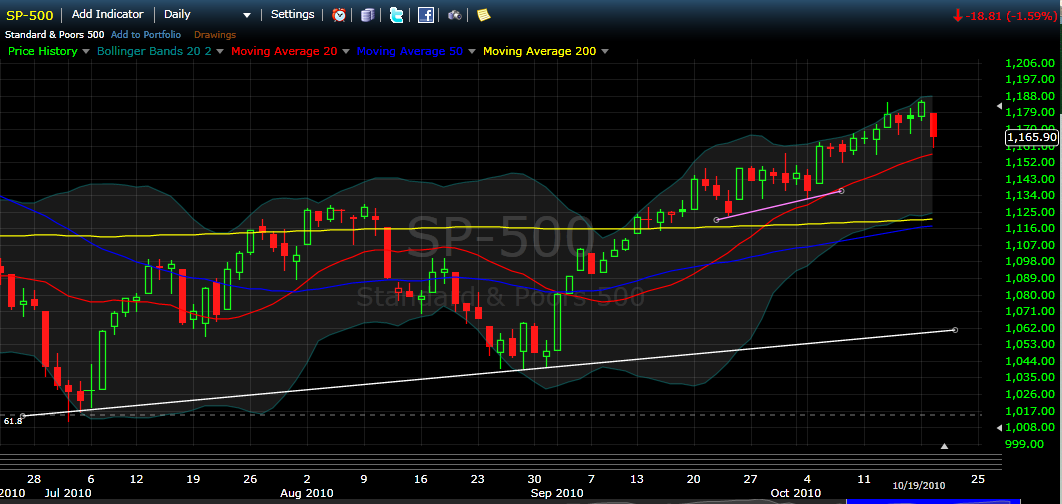
Just wanted to bring to your attention the following.  An identical pattern is forming and the ADX and MACD are following the same patterns.

I have been out of the market until today and picked up some Oil using HOD at 9.14.  with a loose stop.

Gold did not rebound today, so it will be interesting to see how it behaves over the next 1-2 weeks.

Ciena was still weak.  The stock is still stuck under the 50 MA.

Again the importance of trendline analysis.  The 50 MA would be a very good scalp trade to the downside.

Tuesday, October 19, 2010

Market update & Ciena break down

Short post as I have an exam tomorrow I haven't really concentrated on.

I will start with Ciena to demonstrate how Technical Analysis is useful and especially for explanations why prices day to day act the way they do.
Now, I am a believer in Technical Analysis however, looking over my previous posts I always attempt to justify my TA reasoning with Fundamentals as I believe both are extremely important.

So lets start with the trade I made.  As I don't have the best Broker shorting specific stocks are not an option as they don't have the inventory of them.  So I use inverse ETF for indexes / commodities or Put Options for stocks.

Why did I purchase my Put Option on Oct 5th?
Well the technicals told me to. (Not shown but accessible here )

First sell signal was a MACD cross over.  this happens when the MACD line crosses below the signal line.
This indicates momentum has reversed.
Second sell signal is that the Slow stochastics broke below the 80 level after been embedded for a few weeks.  This indicates that momentum has shifted and the stock is overbought.

Now comes the confirmation, the sell volume started to pick up.  The first day should be signal enough to turn short on this given the fundamentals. 

Speaking of fundamentals an announcement that they were taking on more debt started to complete collapse.  One could argue that the stock may not have rolled over if that announcement was not made.  I agree and honestly expected a longer timeframe for the pull back we have seen however the sell signals gave an appropriate entry.  Entering long at that point would be foolish and the probably with following fundamentals only is that you are shooting blind for entry and exits as you are not paying attention to the current price action.

Regardless look at how POWERFUL moving averages can be.  Since this type of action happens so often it is again foolish to cast moving averages as witchcraft or voodoo.

Lets see what happen.  At the 20 MA a gap down occurred the following day on strong volume (confirmation of the move, since "smart money" was willing to be on the short side of the market).  A logical place to stop would be the 200 MA.  That day we broke below it however last part of the day we see that it just managed to close above it and where did it bounce off?  The 50 MA almost perfectly.  Now part of trend analysis is that pierced trend lines will generally break down.  That means that on the day we pierced the 200 MA the damage was down and since there was strong volume on the move one should look for a shorting opportunity.  That came on the marginal up day that follow which is expected since 200 MA is a powerful trend line.  Now other people state that the best way to break a moving average or trend line is a gap on strong volume.   Look where the gap started right on the 50 MA and the break down continued to the downside.   As of now, there is very litter support under this stock, the purple line at 12.50ish is a triangle I have drawn in and I am looking for a possible bounce off that.


Now the over all markets


I have been pretty bearish and I can't claim that this is going to be the massive breakdown I believe is coming (similar to flash crash) however, what is happening is the same as the Ciena stock.  The MACD has crossed over today, the ADX appears that is will cross this week, the Slow stoch appears as if it will fall below the 80 level this week.  These, of course, do not have to signal anything however when 3-4 signals are screaming sell plus volume behind this move was strong then you have to take a step back as say .... should I be going long?  if you don't believe the markets are going to crash then stay neutral until things stabilize.


Two things to note however, Monday night there was a mini flash crash on SPY ETF which is one of the most traded stocks.  This ETF in less than a minute dropped 10%..... This type of action doesn't make sense in an efficient market. Of course the price quickly came back and 50 billion worth of trades was canceled.  This brings another question, does canceled trades make sense in a "free market"? That discussion I will leave for a article I am planning on writing.

Second thing to note is the POMO which are Fed bond purchases.  These happen on Monday , Wednesday and Friday.  Last Friday the markets looked like they were about to roll over and Monday was one of the largest POMO purchases in recent months at 6.3 billion "free money" in the system.  This, of course, pumped the market up.  Today there was no purchases and look what happened.  Tomorrow there is bond purchases so I 100% expect a rally tomorrow unless the invisible hand finally over powers this unsustainable rally.  I think a bounce is likely and I will at the end of the day hopefully pick up some shorts as thursday I expect another day like today.  The big line to watch is the 20 MA breaks below that virtually promise a test of the 200/50 MA exactly like Ciena's case.  Stay tuned for this bumpy ride.  I am currently sitting mostly in cash as I didn't get any entries today, a Gap down in HOD by passed my buy limit. 

Last note is mining stocks, they rally hard and get crushed hard.  One of my favorite stocks SBB is down 18% in 3 days.  This is obviously due to gold dropping 30+ dollars as the USD has rallied.  Which as everyone the USD suppression due to the POMOs have been the reason markets and commodities are rallying.  Looking for a top in this market will provide an amazing entry to gold / silver plays in the future however this could be days, weeks, months away. 

Sunday, October 17, 2010

Financials getting crushed and Oil turn date?

Lets start with Financials,  this is FAS which is a 3x bull ETF that tracks Financial institutions in the states.  The counter part of the ETF is FAZ which is a 3x bear.
Chart Link
The first thing to note about this chart is it isn't following the general market.  It turned sideways at the end of september as the general market has climbed to new recent highs.  I have heard some arguments that say that the general market should be following a similar trend as the fundamentals are not there to support a rally.

Speaking of fundamentals, what is happening with financial institutions?  The main concern right now people are calling robosigning or mortgage gate.  There are hundreds of stories out there so I will not talk about the details of this please see google news search for more information

In a nut shell, banks were foreclosing homes they techincally didn't have the right to foreclose as they didn't have the proper documentation leading to some home owners "taking the law into their own hands" by squatting in their previous owned houses.  The implications are devastating as foreclosed home sales make up 1/3 of existing homes sales and they have effectively been halted until this mess is cleared up.  Also think about it from a buyers perspective, there is a chance that the home you purchase may be subjected to repossession if the bank didn't technically own the house it sold to you. 

Any ways that is the fundamentals behind this sideways action on FAS.  Now..... Techincals are have just began to scream sell.

ADX has crossed over which is a sell signal.

MACD histogram has turned negative signaling downward momentum.  And the likelihood is that the MACD line will break the 0 level by next week reinforcing the fact that momentum is to the downside.

Look at the sell volume the past 2 days, this is what you want to see as confirmation of a trend reversal.

Slow Stochastics have turned down sharply confirming momentum has shifted.

Lastly, the 20 MA was broken and resistance was found at the the 50 MA.  However, the candlestick formation is a continuation pattern and with the other technicals pointing south expect the 50 MA to be broken next week as well.

The implications of this may be severe.  As the general market heading higher, there is some disconnect that will be corrected. Tech stocks led the charge in the nasdaq namely Google and Apple.  In addition to American Financial companies, looking at the FTSE, which tracks Europe financials, the chart pattern appears to be weakening also.

Remember what got the world into this recession, mortgage crisis and banks tanking.  So be wary in the general markets.  A notable stock that got hammered last week was JP Morgan in 3 days the stock went from $40.50 to $37 dollars.  Friday the stock was down  4.29%

Another interesting Chart is the following plotting FAS and S&P 500. Since FAS is 3x bull of the financials it moves much faster than S&P.  However look at the broken correlation.  The link of the chart is below if you want to check other time frames however FAS and S&P tend to follow similar patterns.  The last 2 day the market remained flat and FAS tanked.  How will the market correct this correlation?
Link to chart


Chart Link
Oil has been ranging between the Cyan lines.  Sometimes breaking above and other times breaking below however the range has been approximately 73- 83 since June.   The USD has been getting hammered giving rise to all commodities (gold touched 1390 recently).  The USD has been falling because of QE2 expectations.  The currency war is being perpetuated by multiple counties and QE2 could solidify this "race to the bottom" as weak currency = stronger export sector.  I find it interesting that the US has been calling out China on "currency manipulation" as it has continued to devalue its own currency to prop up its export sector.  Anyways it is my belief that QE2 has been overpriced into the markets and when the announcement comes which is expected to be at the FOMC on Novemeber 2nd the market will correct.
My reasoning is simply that just the mention of QE2 has done what the FED wanted.  Keep the market from collapsing.  By holding back on the amount of QE, it allows for more room to navigate the next downleg in the market.

Anyways back to OIL.
Friday was strong selling a drop of 1.74%.  The top of the range was hit around $83.  I expect the Dollar to rally and oil to head back down into this range.  However, all moving averages have are contained so strong resistance around the 77- 78 level.  Breaks of these moving averages especially the 200MA will result in a retest of the lower bound.
An indication of the momentum shift is the MACD histogram which appears like it will turn negative next week. In addition, on the 11th, the Slow stoch broke the 80 line and began to head south, confirming a momentum shift is underway.   A strong sell signal will be the DI- crossing the DI+ on the ADX.  This appears to still be a few days away if selling continues next week.

Lastly, the purple lines are a triangle that has been formed from the highs / lows in the May flash crash.  It will be interesting to see how well the price action respects this triangle going forward.


Friday, October 15, 2010

Triangle in S&P


Today's action has been quite interesting, I wanted to just note this triangle S&P is currently in.  It appears that it will terminate today however, ending the week caught in this still would make monday a gamble.
There is alot of news out.  Today there was a good Retail sales story which conflicted with a negative consumer sediment which doesn't really make much sense.

USD is up today, crushing oil and other commodities.  It is my expectation that QE2 will disappoint the markets, resulting in a painful correct. 

Look at the scenarios:

1) QE2 comes in as expected
Markets will remain flat and then ask "what next? QE3?"  if there isn't a real growth recovery occuring then then markets will begin to decline as the monetary fix has dried up
2) QE2 comes in better than expected
The world currency war begins as others will have to ease their own currency to protect their export market
3) QE2 comes in worst than expected
USD rebounds and stock markets and commodities get crushed in the correction

Even in the first case, a world currency war could be sparked.  It is interesting that the US government is going out of its way to brand China as a currency manipulator as it continues down the path of devaluation of the dollar for its own personal gain.  Also as the world reserve currency, making everyone holding dollars that much poorer which is the rest of the world and its citizens. 

It will be interesting to see how this day plays out.

Thursday, October 14, 2010

CIENA update


Just a quick note on the CIENA chart.
Position: Put options at 14 strike price for November, purchases on Oct 5th.

The stock has had 3 days down on relatively strong volume.  A news article that is the likely reason for this sell off is Ciena Prices 320-Million 3.75% Convertible Notes

Why such a negative reaction?

I believe the reasoning is the massive amount of debt the company has been taking on.
From their Q3 balance statement we have the following

Convertible notes payable (debt)

October 2009..............798,000,000
July 2010 ....................1,174,580,000

Total stockholders' equity


October 2009..............455,838,000
July 2010 ....................228,295,000

This debt increase has occurred BEFORE the addition $320 million was announced a few days back.


The following information was taken from : Yahoo Finance
It is the entire communication Equipment industry ranked by LT debt to equity and guess who is topping the chart?

It is clear that Ciena is over leveraged and currently requires debt to finance its current debt obligations.

And one technical that has produced a Sell signal is the ADX as the DI- line has crossed the DI+ line today.  The ADX line which shows trend strength is above the 25 indicating a strong trend.


Wednesday, October 13, 2010

Continuation of parallel between this rally and April


I covered the Techincals in a previous post : October Looks Alot Like April
Lets look at each of these segments.  The formation of this up leg is very similar however in my opinion weaker than the previous one in April.  The notable sections are the second from the top.  These are sideways action consolidation paving the way for another push top the upside.  Which we have got today.  Well one thing that caught my eyes was April 16th..... The massive red candle signalled that something was amiss in the markets.  There was a final push to the upside and..... May flash crash.

So what is so important about April 16th??  It was options expiration day.  What is happening this friday in the exact same place in this up leg?  Options expiration (October 15th).

Coincidence ?  Probably however, it is something to be aware of.  A reason I believe friday will play out exactly the same way is that it appears that people are actually starting to believe the underlying fundamentals of the economy are better.  When people start believing that, smart money exits the market.  Remember that people that write this options do not want them to be exercised.  Which means that if everyone is optimistic, a collapse of the market on options expiration day catches many of the people playing it close to the strike place out of position.


Remember that for an economy to be healthy people require jobs.  The job situation has been stagnant, and September's employment situation resulted in 96,000 less jobs. 


Here is an article from bloomberg that baffles me : Fed Considers Raising Inflation Expectations To Boost Economy

"Federal Reserve policy makers may want Americans to expect inflation to accelerate in the future so they spend more of their money now."

I understand the economic principle behind this, however it is ridiculous.  There are millions of people getting homes foreclosed and large percentage of the population unemployed, discouraged, or underemployed, and the government wants to cause price inflation such that people will start to spend money they don't have. 


The real issue is that the government is stuck with no where to go.  My solution has and will continue to be bailout the population with a specified amount of money.  This money has to go towards debt if the receiver has debt.  The money will flow back to the bankers however it will reduce their profits as they are not skimming off the people at the margin.  People will again start to spend money because their interest payments are not eating up all disposable income.

It is impossible to get through this by maintain corporate profits.  The top 1% of the western world requires pay cut, then and only then will the situation become sustainable.


Monday, October 11, 2010

Oil entry and CIENA


I entered a position in oil a couple days back at the purple line in the chart above.  The Stop would be above the cyan line as it is above the a previous high. I am using an ETF HOD by Horizon BetaPro.

The MACD histogram is rolling over in oil, indicating that momentum is fading.  Watch for a cross of the MACD line for confirmation of a sell signal.

The Slow Stochastics has failed to embed and fell below the 80 line today. This signals the momentum is down.  The next quality buy opportunity would be when the yellow line gets below the 20 line and breaks above it as it did the last week in August.

I have a horizontal trend line that I believe will be retested within a month or so.  The other trend line I believe if broke will result into a move down to 72-73 level.


I would like to point out a bearish divergence on CIEN.  This indicates that the momentum has shifted bearish however, price action is still remaining neutral to bullish.  It is then expected for price action to drop at least to 14.88.   In addition the top trend line was put in at the beginning of October and has again came into play today when the price retreated after touching it.  The candle stick formation is again a shooting star which is a sell signal.  Confirmation tomorrow would indicate a reversal on this stock.   It appears that the 20 MA is providing support and the trend line sloping down is the resistance.  This stock has to break out of this within the week.


Well technicals proved to be correct on Ciena. it broke down today and as of 11:30, A bear flag pattern has been created.  I would expect a break down unless the markets magically surge on no news which seems to be the norm.  The news article that caused Ciena's gap down was the issuance of new debt.