Market Scheming

Wednesday, November 10, 2010

Ciena Update and Silver Comex margin adjustment

I still stand by what I mentioned yesterday that I probably should have sold my put options a couple of weeks ago as there was more "time value" on them.  However, looking at the overall markets which had a slight pull back today, which could be the start of a bigger move down, however, I am not jumping on the short side yet as the first POMO of QE2 is tomorrow and if they want to halt big move down they have the ability.  Upwards of 10-15 billion could be injected tomorrow maybe more.  If there is some more selling I will ensure that i have a post explaining bear arguments and any positions I take.  The issue is that the rules of the game have changed, with the size of QE2, it is hard to predict downside movement as every other day the FED has the ability to pump in a massive amount of liquidity into the system.  But I do believe in free markets and that free markets will always win out in the end so a 10%-15% sell off is not off the table.  The issue right now is Europe as there is a lot of negative news coming out from countries such as Ireland, Spain, Greece again.


 Lets look at Ciena isolation.
With this move to the upside on QE2 announcement, we see that it has found resistance at the 50 and 200 MA.  I mentioned in a previous Ciena review that I doubled my position on Oct 25th when we retouched the 50 MA.  These levels are quite important and will continue to be heavy resistance unless bulls take charge in a decisive manner shortly.
For candle stick formations you can see that yesterday there was an inverted hammer formation with today being a confirmation that that signal is valid.  Again, if 20 billion of liquidity enter the market tomorrow all bets are off. 
The stock is also overbought on the slow stoch (not shown) which means a pull back is likely.

The main indicator I wanted to demonstrate today is the MACD.  The histogram has positive ticks which means to me that short term momentum is up, however, you need to be aware of where the MACD line is in relation to the 0 level.  When the MACD line is below 0, the momentum is technically to the down side.  Just like technical levels in price action, the 0 level is very important as if there is still bearish momentum, the MACD line will fail to break the 0 level.  This is what I believe we are seeing now (again in isolation as FED injections are holding prices up).  This will be the first attempt to break the 0 level since the downtrend started.  So i would expect over the next couple of days that the histogram starts to have lower positive ticks.  For anyone that doesn't know the histogram is measured by the difference between the MACD line and the signal line.  If the MACD line is trading under the 0 level like it is now and we get a negative tick on the histogram it means that the MACD line and the Signal line have crossed which is interpreted as a sell signal.

Now for something completely different

  Say it ain't so Silver???
I was just telling some friends about silver and how it is at $29 and how I have maintained a target of $32 since it was in the $17-$19 range.  Then I get home, check my silver / gold mining companies and all my stops were hit.  Lucky me I moved up my stops yesterday night to lock in a solid profit but looking at the Asian market and how silver is now on the climb back up I am a bit annoyed since the stocks could / should rebound quickly.  Due to a busy schedule I am not sure if I will have time to find solid entries into these. 
Also all precious metals got hammered, gold dropped $40 in a few hours.

Remember the silver manipulation case with JPM and HSBC.  The main stream media has finally blown this out of the water.  Anyways, without them suppressing the market, silver has had a hell of a run last few months.  What is interesting is there is some collective knowledge that a massive amount of silver shorts are about to get margin called.  This was around the 28-29 dollar range.  This means that the shorters would be forced to cover, by buying at a very high price resulting in a massive loss.  This buying will result in a short squeeze  causing the price of silver to sky possibly to 32-35 in days.  Well the Comex which is the major exchange for commodities today decided to raise their margin requirements.  This effectively delayed the short squeeze by increasing the price that the margin calls will occur.  The immediate effect is that it allowed more shorts to be entered into the market.  Very curious timing as two large banks are being charged and sued for manipulation that involves massive short positions.  Connect the dots anyway you like but something doesn't seem right with this announcement especially as the margin requirement was only changed for silver.

However, I have not lost faith in silver at all, looking at the 24 clock you can see a gain of $1 from the lows has already occurred, and we are ending Nov 9 higher than Nov 7.  It will be interesting to see how the market reacts in the North American hours.  And how the overall stock market and precious metals correlation holds as QE2 begins and bearish news comes out in Europe. 

As I am effectively out of all long metal positions except for TXG which didn't hit my stop yet, I still have put options on CIENA and the Euro which is also looking weak.  If there is a turn in the markets I am decently positions now, to go short however, if a decoupling occurs, where metal prices continue to rise on debasement of the USD but that debasement of the USD isn't enough to hold the markets up, I may want to go long mining stocks and hedge with a index short.  Possible making money on both trades. 

Lastly, There is an argument that the index has terminated a 5 wave, and a corrective ABC is expected.  Again it might be best to wait on what the size of QE2 POMO tomorrow and the market reaction.


Tuesday, November 9, 2010

Mining stocks sky

What do you expect when Silver breaks $28 and Gold breaks the $1400 mark?

Mining stocks explode.  My current philosophy on mining stocks is that I look for at least some level of production however, junior mining stocks within the range of $1-$7.

The reason for production capacity is that the companies can capitalize on the high prices of the metal right now.   This high price will increase their revenues and will provide excess cash for growth.  With companies without production the issue is that their reverse value will increase which is great but if the metal falls 6 months from now, they didn't technically capitalize on the high price.

In addition, I noticed that at the $5 mark for mining stocks, the company becomes a "mid-tier" which start to attach a new subset of investors.  This has resulted in an explosion in many stocks that I have been following.

Below is an outline of 3 stocks that I currently own, which I purchased last week before the QE2 announcement as a hedge for a large QE commitment which ended up being quite large at $600 billion not including additional rollover.

The 4th stock is FR which I do not own however, have followed and wanted to enter many times but never had an appropriate entry.  Notice the importance of the $5 area for all of these stocks.

$5 mark breach resulted in a strong uptrend.

One of the highest producers of silver in the world.  Notice the explosion after $5.

Looking for my $5 theory to play out in SBB over the next couple of weeks.  As yesterday was the first time the stock closed above the $5 mark.  


Since August almost a 3 fold increase in price.  FR has been a monster.

Sunday, November 7, 2010

Stock Markets break out on $600 billion in QE2

Wow, well I guess I will admit I was wrong.  I 100% did not expect the FED to commit $600 billion to QE2.  I hear a lot of people making the connection that after the FED asked the primary dealers (Here) how much money they would like, the FED gave them $100 billion more for good measure.

Well, if you think that I lost money on the announcement you are mistaken.  The day before the announcement I took 2 gold / silver mining positions as a hedge against the announcement.  The logic was if they are going to go all in then commodities especially gold / silver will sky.  Well it worked like a charm, these companies shot up as gold increased almost double the markets that day and broke to new highs a fraction under 1400 (currently 1394.10).  The power of hedging.  I got stopped out of my S&P short. 

One disappointment I will have to admit is I may not see the highs of the Ciena put options again, which I could have sold last week for 250% profit :(

I have my reservations about this pop as the markets are OVER extended and should be topping.

I will keep tight stops in case there is a breakdown but until their is signs of a breakdown (which come on monday if there is a strong down day as this will complete a evening star candle stick pattern)  but with the fed 100% committed to keeping markets propped the game has changed and you have to change also.

My strategy has and will continue to be:
Depending on the trend:
Short Market / put options
Long Metals via mining companies.  I have added some Chinese solar companies recommended by a friend.

The reason I will not go long the stock indexes is simple, gold has outperformed the stock market for a very long time, and this past Thursday is a prime example of the general trend.
S&P 500 up 1.92%
GLD up 3.35%

Another reason to be long commodities rather than stocks is simple, QE from the FED only has direct impact on the stock markets with the US, but Japan, Euro zone, Brazil, UK all might be doing QE soon to combat rising currencies due to the US bold action.  In this case, gold will go up in response because the more fiat currency there is the higher gold will go up.  These additional QE by other countries will not directly boost the S&P 500.


We are now at new highs since April.  The key to watch is if we hold this level and consolidate and continue up or we head for a correction before an additional push.

Markets can't go straight up (unless they are pushed up which is basically the case) but at some point they need to correct.  With this additional stimulus I cannot say there will be a massive correction however, for this rally to be sustained I honestly believe a test of the 200 MA at 1250-1300 needs to occur. 

The strange thing that happened on Friday is that the dollar rebounded a lot but gold and the markets were up? strange yes.  A dollar rally will have to result in a market break down so keep your eye on this.

At this point the FED is all in, there will be $75 billion dollars a month pumped into the system, it is going to be interesting to see how stocks respond. With this coming in gold to $1500 by December to mid- January is not out of the question.  Some of the mining stocks I am holding are SBB (my go to gold stock however it has not preformed as well as others), EDR one of the largest producers of silver, and AXR.  Others i have on my watch list that i have mentioned in the past are GPR, FVI, FR.  FR has done amazingly, since august it is up almost 150% from $4 to $10.  GPR had a massive breakout since the beginning of september it has increase from $0.84 to over $1.50. 

Silver has out preformed gold as expected with JPM and HBSC being under the radar for market manipulation.  Silver just missed the $27 mark on Friday.


Massive rally, around the 17.50 mark I picked up some physical which I was unsure if it made sense at the time, however, now I am quite happy with the purchase. 

Next week will confirm this market rally or be a reversal week.  until there are strong signs of a reverse it is better to stick to the metals, especially if gold breaks the $1400 mark!! 

Tuesday, November 2, 2010

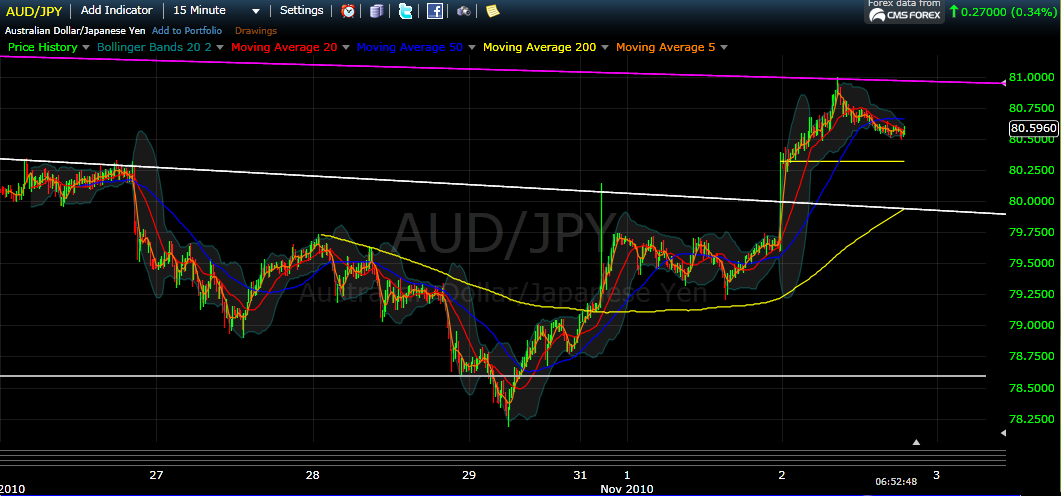
AUDJPY update and S&P line to watch


AUDJPY has made an interesting move today.
Today we have broke through the purple channel but pulled back slightly.  The ADX is technically bearish but a cross of the DI- below the DX+ might occur making this a buy signal.  The MACD also is still negative however it appears it may break through. 

A close of 10 min chart of the tag today.  Everything seems to be at a critical level about to make a move, just in time for...... QE2 Announcement!!! 2:15 pm, Nov 3. 

S&P

On the S&P we have been chopping sideways for 6-8 days.  Today we had a move that failed to break my turning point which was Monday Oct 15th.  It came extremely close.  I have my stops a bit above this high point and we will see what happens at 2:15 tomorrow. 

Last thing I want to mention is the Cyan line.  It dates back to Oct 27th.  If you continue into the future it makes it to the Monday Oct 25th high tomorrow close to the end of the day.  The red vertical line is where the Fed will make the QE2 announcement.  Pretty interesting to see the strength of breaks above or below that trend line. 

Sunday, October 31, 2010

AUDJPY spike on Oct 31st

I was just looking at the Asian markets and noticed the AUDJPY pair.

long term Daily chart below

Short term daily below:

One major note on the chart above is that all moving averages have converged at the 80ish line.  20, 50 , 200.  So this level is key to have.  It is 8:23, and there was a spike that tagged these moving averages.

10 min chart below

8:20 pm EST on Sunday Oct 31st, this spike in the pair is pretty impressive.  Came up and tagged the trend line I drew last post.  This could be the last attempt before a breakdown below the trend line and all daily moving averages or it could be the first major attempt to get  back up to the recent highs.

QE2 announcement is on Wednesday, 2:15 pm. Bloomberg link


Friday, October 29, 2010

AUDJPY vs S&P 500


6 Month comparison of AUDJPY and SP 500

3 Month comparison of AUDJPY and SP 500

From Sept 17th to now comparison of AUDJPY and SP 500

The correlation appears to breakdown around the first week in October.
The 6 month return difference is ~8.5%
The 3 month return difference is ~ 2%
Since Sept 17th return difference is ~4.1%

It seems that a correction to this broken correlation is over due and maybe in the works.
Scenario 1) AUDJPY Rises
Scenario 2) S&P500 Falls
Scenario 3) They meet in the middle AUDJPY Rises and S&P500 Falls

Previous slides have Analysis of S&P 500 So here is the AUDJPY pair

Daily chart

Looks like this pair is at a critical juncture. It has reached the top of this bear channel.  It is now below the 20,50,200 MAs.  If there was a serious break down test of the Cyan line is expect.  Any serious breaks of that might find support at the 72 level and then ultimately the bottom of the channel.

Slow Stoch appears relatively bullish as it is currently over sold.
MACD signal is a sell as we have just crossed the 0 level this week. Stronger negative tick on the histogram = shorter timeframe momentum is down.
ADX is signally strong trend to the downside.


4 hour chart to see short term levels clearer.

I did some quick correlation calculation on the AUDJPY and S&P 500.


Approximately a 7.5% change in correlation between the bottom in 2009 to now and Sept 21st to now.

Here is a graph I generated by calculating the 20 day moving correlation.  (NOTE: 20 days was just a time window to smooth out the data, any time sample could work and even improve this graph.)


What I can see from the graph is that above a 60% correlation appears to be the norm, however breakdowns do occur.  In our current situation the correlation looks like it is trying to strengthen.  The breakdown peaked during the 20 days spanning the last week in September to the first two weeks in October.

Thursday, October 28, 2010

S&P Triangle and Ciena update


10 min chart that shows the symmetrical triangle that we are in.... and guess what?  The ultimate end of the triangle (the point) is...... *drum roll*  November 3rd FOMC Meeting and expected QE2 announcement isn't that a coincidence?


The Daily has basically not moved for 4 days.... today we had a nice doji candle that continues to signal indecision in the markets.   The Slow Stoch shows clearly bearish divergences that predict a breakdown in price action. The line in the sand appears to be that 20 MA that the market doesn't want to let go of.... not just yet as the Midterm elections are early next week with FOMC meeting.

Lets analysis tomorrow...

The Market mover will be the GDP number.
This is a trick situation, lets look at 3 scenarios.

Better than expectations: Good news the economy is recovering, Bad news how can the FED justify the injection of potentially 1 trillion (range from 500 billion to 2 trillion likely), More bad news, the market has already priced a massive amount of the potential QE2 into the markets already.

Worst than expectations: Bad News stimulus QE1, QE-Lite have been failures, should we attempt to do the exact same thing and progress with QE2? Markets will be forced to sell off in this case, this results in QE2 being forced to be massive, this risks a continued currency war as emerging nations realize that they have to combat the falling USD.

Exactly what the market expected: This to me is the only viable option.  However since this GDP number has been revised lower 2-3 times it is a wonder how coming in at expectations is a good thing.  But at least it will not be a major factor in the determination of the amount for QE2

Fed asks primary dealers (banks) to estimate size impact of debt purchases (QE2)
"The amounts dealers chose from were zero, $250 billion, $500 billion and $1 trillion"


An update on my options position in Ciena.
The arrows point to the days that I purchased options.  First time price was around 15.75ish and the second time was when we bounced up to test the 50 MA.  I expected the stock not to be able to recapture this remaining level of support and today was proof that picking up more options at that pivot high was a good call.  We will see how the next few weeks play out however, unless massive QE2 is announced making every market and stock rally on free liquidity then I think a likely target for this stock is $12.50 market initially and then I will gauge how it reacts to this level (bottom of a massive triangle).