Well I don't want to put up to many charts but all my past analysis on this current roll over has been holding true. So here are some updates on S&P and Silver then a look at the DOW on a 25 year chart to see where we are at.
The Triangle i drew in yesterday has now been slightly broken today with an across the board sell off in stocks. Also a breach of the 61.8% retracement of the A wave down. So likely a test of 1000 region is not impossible. Volume up for today on the heavy selling and the MACD has now had a larger negative tick. Signally momentum has shifted. The 50 MA which was helping hold this market up has now broken definitively, confirmation tomorrow would be a nail in the coffin. The Slow Stoch is not oversold so there is room to move for sure. That light purple line is what I am watching that will be a pretty bearish signal along with the yellow line. There could be a heavy batch of sell volume tomorrow or early next week.
This is silver. I am sort of bearish on this right now since I still feel that silver is viewed as industrial metal. So an initial drop could occur and up on the chart there has been 2 days of selling. However, the optimism i have is that there was still a gap up then a sell off that held the 50 MA which was taken out yesterday. I don't know if that means anything but all i know is that it has to get out of that triangle, and either it will have to drop through 2 MA and the trendline at the bottom or just through the trend line at the top. And we know that it can get above this line. It has not broken or pierced that bottom line.
MACD doesn't look good however, the slow stoch are not over bought so there is room to go higher. The sell volume is less than yesterdays as well.
I am holding on my silver positions but have decently tight stop limit orders. I have a couple silver stocks trades that are positive. So I want to cash out before a big crash. I feel i should have locked in my 12% gain on AXR but I want to see what happens to silver tomorrow when it must decide up or down.
Now lets put this market down turn in perspective......
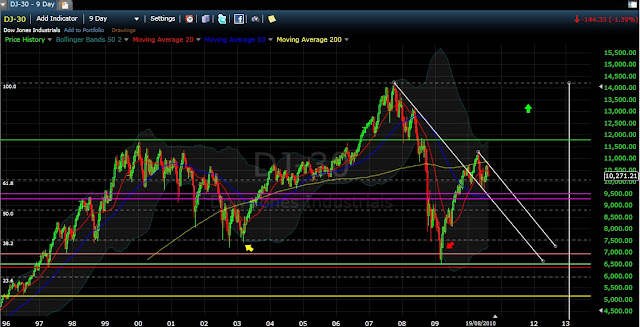
Dow from 1996 - 2013. on a 9 day chart.
1) impulse up to the 11750 ish area then it held the 61.8% retractment for 2-3 years and then broke down to the 38.2% retracement and then took off hitting a peak then had a massive retrace of to the 38.2% level held once and then broke through. The bounce took the DOW over the 61.8% retracement level held that this year a bit and here we are. Notice the pierce of the 38.2% retracement. The time period we are in right now, could dictate if we are going to stay above or break below that retractment. The target I think on this drop might be is in the purple lines. It could still bounce a bit after a couple of dips at this point what news is going to be good. GDP in Q3 can't be looking very good if there is rising job loss claims and bad news in the housing market .
Lets play devils advocate here if this is a completion of a Head and shoulders pattern on this size scale the magnitude of what is coming is massive. Remember, like the previous shoulder chopped up and down for 2-3 years before the big crash. So it is anyones guess however I don't think, if we continue to break some of these key levels, we will make any new highs any time soon.
I it will be interesting to see the next few months unfold, these may be some chaotic times ahead.
I will post a Friday update. It could stay flat as it is options expiration day! yeah! or it could be a mass panic selling to get out before the weekend.


No comments:
Post a Comment