So today was an interesting day, sell off then an attempt to claw back some losses.
Lets look where the close occurred, Just above that white trend line i drew in. Now lets see the importance of this line. And why i expected it to be either heavy resistance or a close below will follow with heavy selling. Firstly it is drawn from the second recent lowest low (June 7th) to through the second lowest low after the low, ( July 20th), it also held on the 16th of August for the latest bounce and held today but was pierced. Why is this line drawn the way it is and why could it be important. Well it is draw because now 4 points have tested this line, also ignoring the low around the 5th of July, the two lows that are connected are still in an uptrend. Matter of fact it is the last hope of an uptrend. all other short term trend lines are in a down trend. Now it can be seen as maybe the most important level to hold, since if it breaks the only thing left is the pick line which is a Head / shoulders pattern neckline, oh and where did the wick of the candle stop and bounce of of? Yup that neckline i drew in days ago. Also the level it held was also the 50% retracement of the latest up leg. Anyways the bulls did their job holding that level, because they just got above it at 2:40 pm est. Any attempt to move higher however was quickly bounced back at the 1073 level. The sell volume is up again today, the MACD has the second day of increase in sell momentum and the slow stoch is not over sold but close. Things don't look good however there could be a temp bounce monday is some news occurs but GDP numbers come out Friday and they are expected to be terrible. That could be the catalyst for a major down turn. The bounce could occur because of the candle stick formation which is a hammer which could indicate a bottom but it has to be confirmed on Monday. But there is alot of heavy resistance with all the MA above where it stands right now.
SILVER.....
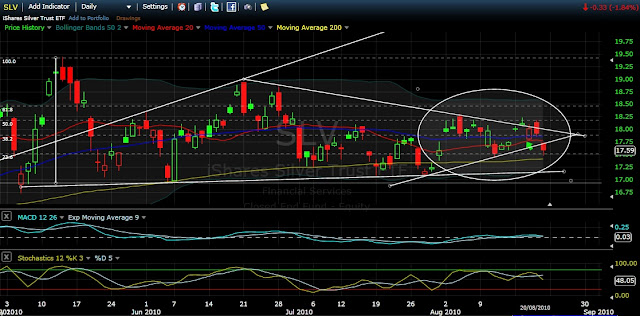
So I bailed out of a position in one of my favorite silver plays AXR. I took profits with a 11% gain, and exited this stock at 3.58 which was the end price on the day. The reason i closed this position was because the candle stick formation was a "hanging man" and the stock looked over extended at this point. I still have one silver play (FR) in motion which i will look at getting out of it things fail next week. Lets look at the SLV to see what happen in the silver market.
So my hope that silver follow gold up instead of following the markets down has been dashed for now. It could still happen but at this point until the 20MA and 50 MA is recaptured I can't be confident that this will hold up against the market turn turn ahead. The silver mining stocks I use do not always trade with silver moves but the major trends etc will be affected so again it was a good place to take an 11% profit on a trade.
MACD has or is about to cross over. Slow Stoch has shifted to a downward momentum. The volume is also up today on the selling. So what was the alarm bells, the gap below the 20 and 50 MA can't be good. the only reason i thought silver might have a chance was that it was entering the close of the triangle with the 20 and 50 MA under it. well what happen? yesterday gap up then pull back below the upper triangle trend line then today a gap down to almost right on the bottom triangle trendline then a sell off that bounced off the 23.6%
Anyways i did up my position in a inverse etf that tracks S&P. My main reason not to wait for a bounce is that at this point there could be a massive selloff anytime, the likely hood of any form of mass buying is highly unlikely. Nothing is pointing to good news. more people losing jobs, less customer confidence, poorer housing market. Until these numbers improve a downturn is quite likely. If we get through these moving averages then i might reconsider my position.


No comments:
Post a Comment