Market Scheming

Wednesday, December 29, 2010

AUDJPY and S&P500 a fresh look


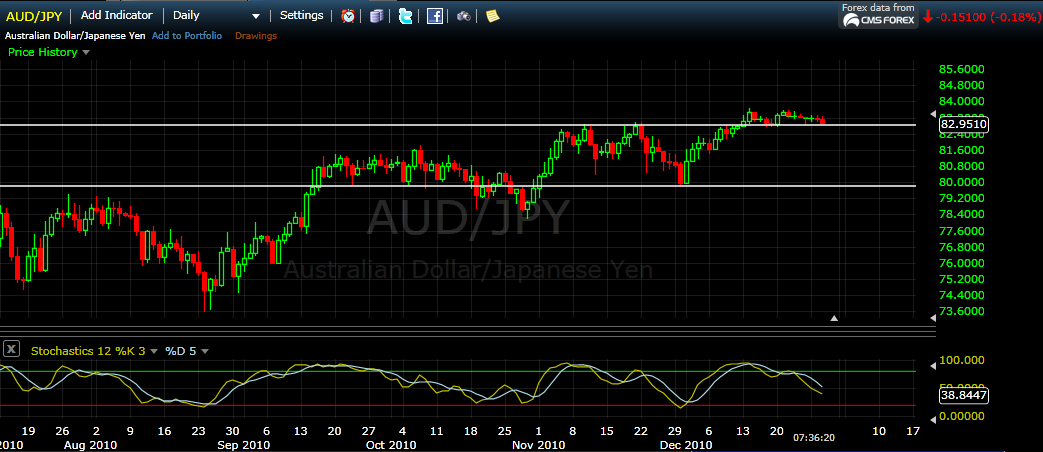
It has been noted in previous posts that the AUD/JPY pair has been highly correlated to the S&P 500. However, recently, the pair has drifted sideways while the S&P 500 has been making new highs.  Looking at today's action, the AUDJPY has started to keel over.
Wanted to note that the Slow stochastic on the daily looks like it is heading south indicating that momentum has shifted to the downside.  You can argue there is a bearish divergence from the Dec 20th low to now.  As the Slow Stoch has declined dramatically the last 3 days. 

Here is a closer look at today on a 15min chart.


On the 15 min chart you can see that as the markets in Asia have opened the AUDJPY pair fell off sharply.  The MACD shows a failure to break the 0 level.  Overnight if this pair heads much lower the US markets could be in a bit of trouble.  

The white line that is in both graphs is a relatively significant level.  If this breaks decisively, 81.50 could be a likely resistance point and stronger resistance should be felt at 80.00 level.

UPDATE:


2.5 hours after that drop, it looks like a retest of that 82.84 level is imminent.  The target for a break out would be 82.65.   MACD looks bearish and however the pair is getting over sold.

UPDATE 2: 9:54pm

The level mentioned above broke therefore the target is expected to be 82.66 which is a Fib projection of the impulse down.


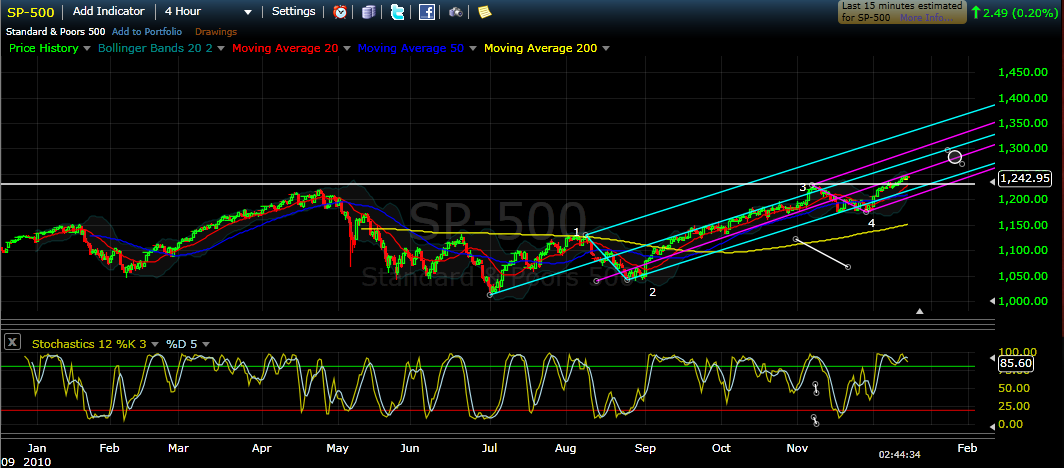
The S&P500 has continued its low volatility climb to the upside. However it is approaching the wave 1 = wave 5 target.


I mentioned before that the target was around 1283-1285, and should occur around Jan 1st.  I think the Jan 5th time frame is more likely, and that also fits to with the fact that holidays are still here. I have suspected that the first normal trading week in January will be interesting, with the options expiration week of the 22nd being extremely volatile.  Remember during this week, with everyone's expectations that the market will go up forever, big players will want to eliminate the need to pay options that are in the money.

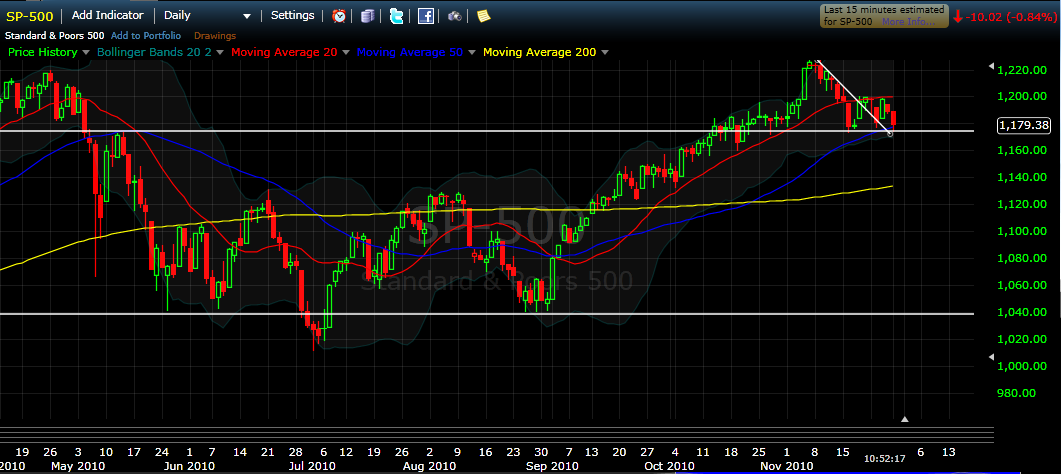
A note on the technicals,  the MACD again looks like it is getting tired and could cross over, however, the Slow Stoch is locked in above the 80 line.  It could be expected that when that K line drops below the 80, the selling pressure will mount.  Be cautions up in the area we are in now.  There is a lot of uncertainty in the markets.

John Degoey was on BNN and mentioned these Canadian ETFs that are pretty interesting: ZJO, XMA, CBR.

Gold Update - SBB.TO Sabina Gold & Silver setup


The technicals on this stock are strong, Slow Stoch is in around 46, and MACD still over the 0 level.

I am setting up a buy stop at 5.24.  If this level is broken, the stock will be trading above the 20 MA and will be close to re establishing an uptrend.


Gold had a strong move on the 28th starting in Asia on the 27th.  Gold is strange these days, it seems like it wants to pull back but always is getting a bid when the price gets to the 1350-1380 range.

Sunday, December 26, 2010

Bottom Falls Out of Gold as Markets Open


What happen at 6 PM as the commodities markets opened?  Did the Chinese Rate Hike contribute to this dramatic collapse? $11 or 0.8% drop in less than one hour.

Look at the recovery?  It will be interesting to see if this rally be break to a new high, if not gold / silver might be in some trouble.  I am a bull long term on metals and hope that later February or March 2011 will be a good time to trade metals.  I think a solid correction to 1250 - 1300 is in the works for gold.  Then it will continue upwards.

Below are a couple major currency pairs I like to follow.

AUDJPY

Momentum is down and it looks like a pull back is in the works for AUDJPY.   If the correlation between S&P500 and the AUDJPY holds this means that the S&P500 will also pull back.

This next 2-4 weeks will be very interesting to see play out.


EURUSD

The 200 MA is providing support however, this support could be short lived.  If markets in the US start turning, Euro zone could be in for a sizable decline.  Ireland, Greece, Spain, and Portugal are still weight on the markets. If this 200 MA support breaks it would be expected to see a 1.26 eurusd in a few weeks.


China hikes interest rates 0.25% in hopes to smother inflation

Wanted to bring some economical fundamentals in to the picture as well.
China raises interest rates by 25 basis points

The long awaited interest rate hike has just occurred today.  Since China has their Yuan pegged to the US dollar, a rate hike will be viewed by the markets similar to a US rate hike.  The Chinese have attempted to curb inflation via other methods such as raising the reserve ratio for banks three times.

Inflation is not going fade this easily, and western economies need to take note of what works and what doesn't work as I expect when inflation makes it here, it will be fast and furious.  The biggest danger is the static nature to the majorities salary contracts.

Anyways this move by the Chinese central bank will make for an interesting Monday morning.  However, job well done by wall street leading up to Christmas.  Lets make people feel good enough to spend a record amount of holiday shopping. It is annoying that apparently spending money has now become a "patriotic"  action.


 S&P 500 and Technical Analysis methods

I wanted to just mention a couple of notes on what methods / beliefs in Technical Analysis.  Mainly I want to ensure people realize that I haven't made my mind up on what technical indicators / theories work or not.  I do not advocate for one or another, I just want to present viewers with an assortment of different ways to look at stock, commodities and forign exchange markets.  From Elliott wave to MACD, all of these are interesting and should be played with to see how it can be used within your own methods, if it doesn't fit don't use it.

I enjoy reading up and learning different techniques.  For example the following is the usage of Andrew's pitchfork to predict level and time.


Looking at the S&P 500


I would like to note that the 1260 and the 1300 level are still critical and equating wave 1 to wave 5 coincidentally, wave 5 should end on December 31st, 2010.  The Cyan line for Wave 1 was drawn from the low to the high.  Wave 5 would end at 1290 which is in the range we just noted.  The 1300 is psychological and could be the natural top to this impulse wave.

The andrews pitchfork is divided by time as well.  As you can see the two targets are around the 1304 mark by January 1 (markets closed) or the 1260 area around the January 16-17.

I will repeat that the options expiration for January 22nd, looks like it could be a wild ride.  Holidays over, market over extended, oh ya every crisis from Europe to unemployment to Koren tensions are still  here.


Wednesday, December 22, 2010

S&P 500 approaching previously stated levels


Two levels I mentioned in a previous post: the 1261 - 1265 range and 1296 to 1300 range.

These are the next significant levels, so watch for selling in the new year.  Remember no way the markets can disappoint Santa, higher the market goes up more people shop, translating into a "recovery".  That is the plan of action.  So I do expect that drifting higher for a bit longer, but  January / early February could be an interesting time.

I think the January options expiration (Jan 22) week will be an interesting one.  It will be interesting to see how the holiday numbers come out this year, I have a feeling that they are decent but honestly hope they are not very good as that means people have finally realized that they need to retrain their spending to pay off their debt.

Strange thing is the continued divergence with Gold / silver and the markets.  As the markets drift higher, gold and silver have flat lined.  I have a feeling they will converge quickly, either gold / silver jumped 2-3% or S&P 500 falls 2-3% or a mixture of gold/silver up and S&P 500 down.


As you can see since December 9th, silver has not gone anywhere.  Last 3 days have been exceptionally quite.

Not sure which direction but this beast might come alive soon.

Monday, December 20, 2010

SLV 3pm December 20th

A couple of POMOs happened today with 10+ billion in bonds being purchased.  As you can see they affected the silver chart dramatically.

Can you guess where they happened?

Important to note the volume around 2 pm.  In my opinion, that volume spike has placed a decent resistant point 28.65 on SLV.  In the morning. made a trade 7.03 to 7.16. And I am going to get a position by the end of the day.

Cyan = entry
Purple = exit
Start = 11am ish

This time period coincided with the POMO


Thought this was a very interesting chart.

From: ZeroHedge.com

S&P 500 Review - December 19th, 2010


Markets have continued to rally.  The Slow Stoch is embedded meaning strong trend.  The MACD histogram is starting to decline however the MACD line is well above the 0 level.

It is still my belief we are in a 5 wave, and therefore a corrective phase is approaching.  From the recent highs the corrective phase most likely will take the S&P500 to 1167 (38.2% retracement), 1140 (50% retracement and 200 day MA) or 1120 (61.8% retracement).


 30 min chart - Slow Stoch is overbought, expectation of small pull back Monday or Tuesday.


I have some put options on a 2x bear etf for the S&P500 for a January expiration.  In the mean time, I have been able to successfully play SBB and EDR on the TSX.  These metal mining companies have been hit hard last week as gold and silver tumbled.  However, looking at the current gold / silver price action it appears that they may have a good week.


Current gold price from Kitco
Current silver price from Kitco


Saturday, December 18, 2010

Tuesday, December 14, 2010

Elliott Wave S&P 500

My attempt at a count of the S&P 500.
Interesting thing about Elliott wave is it is Fractal


Below is the Mandelbrot set, the most famous Fractal pattern.


I plan on studying Fractal math just to get a better understanding on the dynamics of a pattern.


From this website

These are my targets and the first one is around 1260.71

4 hour Chart


Hourly Chart

I think the 1300 mark makes the most sense at this point, as it is in the area of a Fib and it is psychological.  Also wave 1 = wave 5 equity is around 1292.70 which again is close to the 1300 mark.  W1 = W5 for time is about February 28th, 2011.

If this count is correct, the implication is that the 5 wave impulse from the lows in July will end.  This will lead to a correction.  At a minimum (38.2% retracement) the S&P 500 should fall to 1192.50 level, and the 61.8% retracement will be 1123 level.

I will keep updating this count as an experiment with Elliot wave.  Would like to learn more about it and judge how effective it can be.

Thursday, December 9, 2010

S&P Elliot Wave analysis - Irregular Correction & EUR/USD divergence


I will start off with mentioning some videos that have provided an interesting count.


Target guidelines from the following was used:
http://www.esignalcentral.com/university/get/getManual/eSignal_Manual_ch9.pdf

Starting with a longer term chart


So Above is the daily chart.  It is a bit hectic, however, I didn't want to erase everything when zooming out.
Man thing to note is where we are in the wave count at this scale.   August 2010  terminated Wave 1.  I did some research on Andrew's Pitchfork  Video of action / reaction lines Here

Based on pitchfork time projection, mixed with Fib levels and elliot wave, a short term projected target of 1145 - 1155.  The big red dot.

Wave yellow B touched the 61.8% retractment of the breakdown of the markets in 2008.  This point a short term top, in my opinion until it is taken out. 

Once Wave 4 completes, wave 5 should go to modest new highs before terminating, leading the way for a strong down move in the indexes.

Closer look at the price target on a hourly chart.


On the shorter term count, the cyan count seems to have terminated, making the high 1235.

With a clear impulse wave down off the 1235 mark, the correction can be seen showing a bearish divergence.

So to sum it up, we might be about to continue a 4 wave down on longer term chart.  Which means news highs are expected, by next February.  Price target of 1255-1260 on the wave 5 up.
On the shorter term, it appears our irregular correction has just put in a B wave.  This means we have entered into a C wave down that should take out the A Wave at 1175.  With the target of 1145-1155 this price target is also 1.62 x Wave A which satisfies the fib targets of a Wave C.

From the PDF above on Elliot wave here is a picture of a irregular flat.

See more here


Just a EUR/USD update.  Bearish Divergence based on the purple lines.
Expect to see the Euro fall against the greenback.  Price should breach 1.26 if the divergence is to play out.


Tuesday, December 7, 2010

S&P 500 - December 7th, 2010


Weekly chart of the S&P 500: Interactive Charts powered by freestockcharts.com

Hello 61.8% retracement.  Today candle stick pattern was a Shooting Star

Lets attempt to overlay some Elliot wave


A bearish candle, off a 61.8% retractment is interesting.  Tomorrow look for confirmation.


On the monthly, it is always nice to see where we are currently over the longer term.

Why Economics Matters by Satnam Lehal

New Palgrave Economics Writing Prize Winner 2008–9

We are very proud and happy to announce the winner of our competition launched in association with the Financial Times and the London School of Economics– ‘Why Economics Matters.’ Satnam Lehal, 31, a graduate of Oxford and Cambridge Universities who works in financial services, won the £1000 prize this year. For more information and updates about future competitions, please keep coming back to this site.

Why Economics Matters by Satnam Lehal

Located on this site: The New Palgrave Dictionary of Economics


"The New Palgrave Dictionary of Economics (2008), 2nd Edition, is an eight-volume reference work, edited by Steven N. Durlauf and Lawrence E. Blume. It contains 5.8 million words and spans 7,680 pages with 1,872 articles. Included are 1057 new articles and, from earlier, 80 "classic" essays, 157 revised articles, and 550 edited articles. It is the product of 1,506 contributors, including 25 Nobel Laureates in Economics. It is also available in a searchable, hyperlinked online version with added content from quarterly updates. The publisher is Palgrave Macmillan. The first edition, The New Palgrave: A Dictionary of Economics (1987), was published in four volumes.[1][2] Institutional access to full-text online articles for both editions is available by subscription.[3"

Wikipedia: The New Palgrave

Monday, December 6, 2010

GOLD hits new all time high, Sabina Gold & Silver SBB on TSX news release


Today a new high was made in gold.  Impressive yes, unexpected not really.  This commodities will continue to rise as long as USD is being hammered and the world is fearing a breakdown in Euro zone.

I have mentioned previously that my strategy for markets right now, is when I am feeling bullish I long gold / silver mining stocks, some of these that have done extremely well are: AXR, FR, SBB, GPR, FVI, EDR.
If I am feeling bearish I just stick to inverse ETF to short the stock markets.

Currently, I am holding only SBB, with a Buy - stop on FVI at 4.64
I also mentioned previously that the $5 stock range is interesting, as it seems that additional investors get involved after this price level is breached for junior mining companies.

Daily chart of SBB below

Some strong volume has recently entered the market as you can see last week there was a massive increase in the price.  I picked up on the pull back.

What is excited is a release at 4:20pm after market close from Sabina Gold and Silver corp on the final 2010 reading for their mining properties.

Here is the Article from marketwire

Also the report from the company website 

The highlights are the following
"Hole 10GSE136 returns 8.74 g/t Au over 79.9m including 45.20 g/t Au over 6.0m and 25.27 g/t Au over 4.9m
Hole 10GSE140B returns 18.95 g/t Au over 4.35m and 26.43 g/t Au over 2.9m"

Based on previous results for the same property these are significant results.  This stock will be very interesting to watch this week.

Also they have targeted potential drilling targets for their 2011 exploration program.

Source: Sabina News Release Dec 6th, 2010

Friday, December 3, 2010

A sobering wake up call to the world

Well I guess reality will be extended for a few more days/months. 
This video basically sums up the situation:


In addition, it seems there are a few people that are trying bring reality back.  Remember in Europe nations such as Greece and Ireland were forced into  austerity measures since they do not have control over their monetary policy.  IMF and European Central Bank imposed measured to raise taxes, cuts spending, and even lowering minimum wage in Ireland.

As the states are the quasi-world bank, they are in complete control of their monetary policy there is no pressure to reduce debt.  This is abundantly clear from the below bloomberg article.

debt plan rejected
“This plan will make an important first step forward in proving something, in proving our nation understands the peril of our ever increasing deficits and that our leaders are prepared to do something real,” said panel co-chairman Erskine Bowles before commission members began announcing their votes.
There is 0 political will to actually do what is required.  There will come a time where it is realized that the unpopular choice is the only choice.

Additional proof of the failure of the current path we are on is:

Unemployment Rises to 9.8% as U.S. Adds Just 39,000 Jobs

So rising unemployment as billions of dollars a DAY are pumped into the system (today 6.8 billion), should open some peoples eyes. 

I starting going long metal mining stocks again, but I am not counting out STRONG selling coming in at any point probably within the next couple weeks.  If not, I guess the extend and pretend mentality wins until the next sovereign debt issue.

Below is a current US debt holding, Something doesn't seem right that the FED is the number one debt holder
This is borrowed from ZeroHedge article here


Explosion of debt ......


Tuesday, November 30, 2010

Nov 30th: World markets in for a bumpy ride


As mentioned in my update to my last post, the S&P500 and other US markets at 2:30pm rallied fearlessly off.......  not really sure.  There was absolutely no reason for this action but it is expected when you have 2 POMO's in a single day.  As pointed out before, watch the volume in the SPY to see how this game is played.  Those that bought into the rally that didn't realize it is a setup will be banging their heads tomorrow when the market gaps 10-15 points down.

First thing to note is we are in a sideways to bearish trend.  We have not made a new high for weeks now.... until we do why buy?  trying to pick the bottom will be a losing game in this market.
Second thing to note is the geopolitical and macroeconomic forces at work.

Borrow some charts from this post from zerohedge
This is the AUD/JPY on a 1 minute chart.

you can see the nice rally at 2:30 when the S&P500 shot straight up, however all of that and more (currently 80.82) has been recovered by the bears.  So what happened at 10 pm ?

China spoke above interest rate hikes.  Remember since the Yuan is tied to the USD right now, any interest rate hike has the same effects if the US raised interest rates.   Which means stronger USD and since the markets are only rallied off the suppression of the USD it means lower markets.  If China is serious about a 0.50% hike before January this could have dire consequences for the markets.

Why is China raising rates?  Unlike here their economy actually is growing quite fast.  Some speculate that they have a housing bubble etc which could be true. 
Many people have been saying that the reason QE is not going to work is simple because if you make holding USD less valuable thus increase risk appetite a lot of the money will just go fund oversea companies mainly in Asia since they are growing offering higher reward for each unit of risk.  As an investor it makes logical sense, so that is why we see strong growth in nations like China, Singapore, South Korea, etc.

Anyways, I have maintained a short position which I got into a couple of days back at a top.  And since we haven't taken out a previous high I will maintain this position unless there is real reason not to.

Last note on what  I believe occurs at market tops and more specifically this potential market top. 
The market increased ruthlessly since QE2 was announced, there was never a really entry into the market unless you straight chased.  No definitive pull back that reversed on strong volume.  So this is the first time we have seen real sideways action.  Well investors that are under the believe that things are all good will buy into this market. Who is selling? major institutional investors.  They are buying when the time is right 2:30pm and they are slowly off loading their shares when time is right like today at 3:55 pm.  But Net they are holding less than they did yesterday and that is the key here.  Over this massive choppy action each day the "smart money" is getting out of this market.

We will see what tomorrow brings but I am still calling at least 10 point gap tomorrow leaving everyone that bought into the rally yesterday wondering what happened.

Monday, November 29, 2010

S&P 500 critical level, Dow trading below 11000


Today's low so far was 1173.60 which if you look back in time is approximately where the rebound after the flash crash failed.  This level also was just below the 50 MA meaning we have pierced it.  Piercing a trendline is an early warning of a trend line break.  This isn't to say we can bounce up for a week or so.  However, closes below the 50 MA should be viewed as extremely bearish as there is little support under the market.  Next stop 1140 where the 200 MA is then I would think 1040 is a likely target for a test.  If the market gets above the 20 MA and holds then maybe start looking for long positions, I stress maybe as eurozone and all of the instability with Korea is not a positive for the markets.

Also note today is the first double POMO day which apparently doesn't work the way the FED had hoped as geopolitical instability trumps bond purchases.  VIX is up past the 23 level and dollar is in a strong up trend both a negative for the overall markets.

UPDATE: close


I used the SPY here to demonstrate the volume on a 5 minute chart.
Like the past few weeks, a common volume trend is strong sell volume...

Looking at the magical rise of prices exactly as the clock hits 2:30, the volume is telling....
At the end of the day, the buyers have cashed out.  Leaving whoever chased holding the hot potato.

Like Nov 22nd, I expect a gap down to start the day.

Sunday, November 28, 2010

Nov 28th, 2010: Eursula, and STL indictmento Debt burden, Wikileaks, Korea Penin


4 major geopolitical and macro-economical news items to be aware of


1 - Euro Debt Burden

ZeroHedge: Eurozone Cheat Sheet

There is a million things to say about the above statistics but I will limited my comments to the graph on the bottom right.  It shows the maturity due dates as a % of total debt for each country in the Euro Zone.
Coupled with the overall Debt to GDP ratios a stalk future awaits us.  Yes we will be able to push off this Ireland situation off for a few more years, but what happens in 3-5 years? Portugal, Italy, and even Belgium doesn't look in very good shape.  I think a lot of people are short sighted on global debt situation.

2 - WikiLeaks ~2.8 million leaked documents
WikiLeaks threat sparks massive review of diplomatic documents

Wikileaks: US warns allies on potential diplomatic leak
"Reports say Turkey, Israel, Denmark and Norway have also been warned to expect potential embarrassment from the leaks."
"State department spokesman PJ Crowley warned on Wednesday that the release could weaken trust in the US as a diplomatic partner."

It is rumored that the leak will be coming 4:30 pm Sunday 11/28/2010, but having seen mainstream acceptance of that time frame.

3 - Korea situation heating up, US and South Korea continue with joint exercises
Artillery Heard in North Korea; U.S. Carrier Enters Yellow Sea

"The echo of shots rang out this morning, said a South Korean Defense Ministry official who declined to be named, citing military policy. While residents were later allowed out of shelters, the aircraft carrier USS George Washington joined South Korean vessels for four days of drills.
U.S. Admiral Michael Mullen, chairman of the Joint Chiefs of Staff, said the U.S. is trying to prevent the tensions over North Korea’s Nov. 23 attack on the South Korean island on the disputed maritime border from escalating into a more significant confrontation."

"Earlier Saturday, China launched a flurry of diplomatic activity to ease tensions on the Korean peninsula after North Korea's shelling of the island.
China has warned it opposes any "unilateral military act" in the area without its permission, referring to the U.S.-South Korean drills.
Admiral Mike Mullen, chairman of the U.S. Joint Chiefs of Staff, told CNN (in an interview due to air Sunday) that, as North Korea's closest ally, China has as much at stake as anyone if the region is destabilized."


4 - CBC leak and upcoming indictment
This situation will cause an escalation in the region.  It will be interesting to see how the UN approaches this announcement which apparently will come Thursday Dec 2, 2010.

CBC Investigation: Who killed Lebanon's Rafik Hariri?
Phone Chart

 
STL: Saudi envoy expects a major breakthrough soon
"Ad-Diyar reported that the Lebanese Foreign Affairs Ministry received a notification from Lebanon’s Embassy in the Netherlands that the Special Tribunal for Lebanon (STL) will issue its indictment on December 2. Lebanese Ambassador to Netherlands Zaidan as-Saghir has reportedly also confirmed that the indictment will be issued on December 2"

Friday, November 26, 2010

Nov 26th, 2010 - S&P 500 lower highs

The market had a hell of a rally, however, as European situation was brought to center stage by Ireland reality has been kicking in. Ireland will be voting on austerity measures December 7th, 2010.   In attention to this Korea tensions are increases. Most relevant this weekend is the imminent release of 2 million documents from WikiLeaks.

A sample from the linked story:
"U.S. officials said the documents may contain accounts of compromising conversations with political dissidents and friendly politicians. They also could damage U.S. relations with allies around the world and result in the expulsion of U.S. diplomats from foreign postings."

Yesterday the markets were closed and today they closed at 1pm.  Obviously the volume was extremely low today, as who would say no to a 4 day weekend?  


The major aspect of this chart is the lower highs since beginning of November.  A previous high has never been taken out, and the 1200 level is proving to be strong resistance.  Since breaking this level, the price action has stayed below.  The Nov 19th high was 1999.97

If the 1200 level breaks, it will be a good intraday play to the upside.  However, until price gets back over 1215 this market in the short term is bearish.
 

Wednesday, November 24, 2010

S&P 500 - 1200 proving hard to break


This is a daily chart from the flash crash until now.
This chart can be accessed here.


Technical indicators

Volume - One of the most important things to note today is the low volume.  Much lower then the average.  What should be noted also is that low volume usually means markets flat to slightly bullish.
MACD - Momentum is down on the histogram.  The histogram is the measure of the distance between the macd line (blue) and the signal line (white).  However, macd line is higher then the 0 level, which is bullish.
Slow Stoch, has dropped dramatically, failed a bounce and is now at 35.   Which means the market is not overbought or oversold.

ADX line - This is interesting,  the bearish crossover occurred however the yellow trend strength line is lower than 25 which means the trend isn't strong.  Usually a cross over with strong trend should be taken as a buy / sell signal.  So this is bearish but not strongly bearish yet (trend may pick up if a continue of the downside happens short term).

Trend lines:

Purple:  Recent low, appears to be a level the may flash crash rally occurred.

White: The bottom white line is the 1200 level.  I think this is more of a psychological level that is acting as heavy resistance.  The hourly is below with more details.

Cyan:   A line was drawn from the low point to the breaking point of the may flash crash.  That like was then copied and placed at the low point of the current rally.  Result was a battle being fought at the predicted level and time period.

From this I believe that 1200 is the level to watch, lets see if the bulls can get back up and over 1200.

From what I see, there is not much of a catalyst to the upside.  QE2 was the catalyst for the current rally, hope/expectation of  an improving economic picture is also driving the upside.  Downside catalysts are :
  • Situation with the euro zone: Greece, Ireland, Spain, Portugal, Italy.  
  • Potential war in Korea
  • Heated up tensions in the middle east with: Iran, Iraq, Afghanistan, Lebanon, Israel, West Bank, Qatar 
  • China need to cool inflation but continuing to raise interest rates
  • China and Japanese tensions 


I think the most important economic story is Irelands proposal for austerity measures.  This package has to pass parliament on December 7th, 2010. The opposite are going to be faced by a situation where politically all they need to do is fight for the people and reject the proposal.  However, economically the only thing that can be done is this package.  And this is the going to be the the hard part for all countries around the world, mainly in the west. The system is not sustainable. Yes we can continue this for 5 years. But what about 15 years? I doubt it.
Lets see what happens when the economy picks up.  Inflation raises.  Lets say at the 2% target.  Anything above this interest rates needs to rise to bring it down.  What happens to all the mortgages ?  The debt that people, countries, corporations will rise.  The increase on interest payments are going to be what cripples the economy. 

So austerity measures are the only alternative to inflating our way out of this.  This would mean that the borrower is who is rewarded. This means that if interest rates do not adjust, it would be much easier to pay off your loan.  Since the government is racking up huge debt levels, they too will be able to pay off the debts faster.

This becomes a special case when a country has world reserve currency.
The Triffin Dilemma is :

The Triffin dilemma (less commonly the Triffin paradox) is the observation that when a national currency also serves as an international reserve currency (as the US dollar does today), there are fundamental conflicts of interest between short-term domestic and long-term international economic objectives.

In addition to this, everyone in the world holds US dollars.  This means that inflation / devaluing the currency. is making every country poorer.  However, there has been a strong trend of countries increasing their gold holdings.  Iran has recently purchased a sizable quantity of gold along with Bangladesh (mainly mid east and South East Asia).


15 minute chart.
1200 level is Cyan.  Purple lines are the range I think that is relevant and watch for a break out of either.

4th Attempt at 1200, and the attempts have been trending lower... This confirms the momentum oscillators being bearish.

Sunday, November 21, 2010

GM update: 5 min chart Bearish Divergence


An update on GM IPO.  Friday morning came close to the issue price of $33.  However a nice bounce back occurred.  While looking at the chart I noticed on the 5 Minute chart that a bearish Divergence occurred.  This Divergence is also confirmed on the MACD.  As this is a short term chart, I don't predict any massive move down, but to see GM next week trade at some point between $33.50 and $34.00 is not a stretch. 


The overall market however may find a boost as Ireland will announce a bailout before Monday, which will involve IMF and ECB.  The markets reaction to the confirmation that Europe's financial situation is on the rocks is quite funny.  This also proves that the "stress tests" that were done were not stringent effort to be of any value. 

Portugal should be on the radar next along with Spain.

Thursday, November 18, 2010

EUR/USD and AUD/JPY at Critical Levels


The daily is above, I believe the level we are attempting to break is critical, as in April the price retreated from this level, and more recently we have tested this level a few times.  If this level fails to break, and price action gets below some of those moving averages this currency pair could be in trouble.   Also the correlation of the S&P 500 and this pair has been demonstrated in previous posts, but simply look what occurred during the may flash crash.


A hourly view allows is to see the recent tests of the level 82.75 level.  Currently we have broken the 20 MA hourly.  If we continue down over night expect the S&P 500 to start lower on the day.

The European issues have not been settled.  The Irish bailout is still in talks, however, with today's rally and dollar drop it would be expected to see the EUR/USD up.


One thing I wanted to note on this chart is the MACD has just crossed the 0 level today.  This generally signals mid-term bearishness so look for a retest of that level.  If it holds more downward movement would be expected.  Again, looking at the level in price action in April the top coincides with level we are battling.
The hourly shows the pressure from the 200 hour MA.  With a squeeze occurring with the 20 hour MA.

The slow stoch would be good to look at, any breaks below the recent low would be a sign for continued selling and a shift in momentum.