Market Scheming

Friday, September 10, 2010

Hello Mr. 200 MA

The pop was above the trend line which was surprising however, look at the Shooting start / inverted hammer formation.  This candle stick pattern is a reversal pattern that does require confirmation, so tomorrow if the markets retreat, the odds are in your favor if you short it.  This could still be risky and might not be worth holding over the weekend. To learn more about this candlestick please visit: Shooting Star.


On the hourly, the bearish divergences discussed in yesterday's posting seem to be playing out.  With the Slow Stoch showing that the momentum is down.   I am impressed that the S&P stayed above the trend line.  Nasdaq for example closed below a similar trend line.

Another note today, is that the job loss claims came in better than expected so the gap up to start the day, then a pull back all most of the day.  Also metal market got hit, the mining stocks I am currently in have not lost value so I have tight stops in case they do reverse sharply.  This could be the start of the gold pull back i mentioned a few weeks back but was caught short when the market continued higher.  I will be a strong buyer when the market corrects, possibly to the 1210 area.  Silver also declined so my initial plan is to cash out if the market starts lower, and decide what to hold over the weekend.

I will say that breaks above the 200 MA I do not expect to last, I see a tag of that level will quickly reverse the S&P, but light volume always has an upside bias so it may drifted.  What is required is a catalyst either up or down, with today's positive numbers I expected the markets to trade much higher.

Next week is Quadruple Witching, so volatility is expected to be higher.


I am planning are starting to research how to use the indicator : ADX / DMI Apparently it can give some interesting insight.

Wednesday, September 8, 2010

Potential reversal on markets and metal markets.


How curious is it that the trend line that i have been talking about as potential resistance has held 3 days in a row? This indicates to me that their is a potential reversal in this market.  I do not expect it to get above that purple line after seeing it hold so well, how ever, any very bullish economic data could break that line.  I am debating about shorting the market here but the safe trade would be breaks below the 1040 level for a short.  For going long, I would say if there was strong volume moves above the 200 MA, which is at the 1120 level.

Looking at the hourly:

The indicators are bearish but the most notable signal i see on this chart is the bearish divergence on the Slow Stoch.  The last week and a half you can see the slow stoch has made a lower low but the price action was a higher low.  See Bearish Divergence for more information.  What this signals is that the rally is on false footing and will take out the low of 1040 at some point in the future.  Since the overall trend is down this bearish divergence pulls more weight.  I will talk about Silver next which i believe could also be ready for a pull back to regroup before a push over the $20 - 22 level.  If I exit from some of my positions I may consider a short in the market however it would be relatively high risk until the 1040 mark is taken out.


This is SLV, a silver ETF that mirrors silver price action.  As you can see from the daily, the price action is at the high range of this trading wedge (purple).  The recent rally can be explained from the light blue wedge that was broken to the upside.  The fib levels on the daily show from the first impulse wave of this rally the levels of potential support and resistance.  I believe that if silver was to reverse for a consolidation the 161.8 level is where to expect resistance.  The 18.30 mark on the SLV would be the target which would equate to a 6.1% decrease in silver prices.  This would be in my opinion the last big buying opportunity before the break out.  However, if silver (and other metals) manage to break out of their all time highs, I would continue to be bullish, however it looks like they may be over extended at the moment and a pull back to regain momentum makes a lot of sense, especially if the magnitude of the breakout is as large as some have predicted.

 
Another potential target for a pull back would be the 61.8% retracement of the recent impulse wave which would be just below the 19.00 mark.  My plan of action is to ensure tight stops on my positions if tomorrow is a reversal day.  I wouldn't mind siting on cash for a couple of days to see what plays out by weeks end or the start of next week.

Down day to start the week.

The S&P was down 1% today, which was expected since there was a strong 3 day rally.  Is this a pause day or a trend reversal is the real question.  I believe that any down movements can cause a break down in the markets with the right catalyst since the over all trend is still down.  So I am not bullish until the 200 MA is cleared but on a short term basis.  As breaks above the 200MA since May flash crash have not been sustained but a short term rally would be expected.  For a down trend to be confirmed, breaks below the 20 / 50 MA are the areas to look.
Here is a daily chart of today's action.

The MACD has a higher positive tick which indicates bullish momentum however, the MACD value is below the Zero line which is bearish, I like to view Histogram as the short term trend and the MACD value as the longer term trend.  So this would be considered a counter trend move.

The Slow stoch is still over bought.  I mentioned this on Monday, the slope of the yellow line as it enters the 80+ territory seems to matter.  Also the longer the yellow line is overbought and the white line is <80 the more downward pressure there is on the market.

See how that upper purple trend line I had drawn in held so well today?  The open was a gap down below the trend line and then a constant move south.  The candle stick formation is a bearish continuation patterns.

Overall Expectations:
- Bounce Can continue but not for to much longer.
- I do expect the upper purple trend line to hold, however if broken the 200 MA will offer up pretty heavy resistance.

Positions: I am not playing the market either way right now as i am currently in long positions in the metal market (3 junior mining companies SBB, HRG, ELR on the tsx).  I have about 8-10 mining companies I follow and attempt to determine breaks outs.  Silver is on the verge of breaching $20/oz, and close to its recent high of $23ish.   Target for silver I believe is the $32 mark possibly

SBB update.
I have been waiting to see a breakout of this stock for the past few trading days, I added to my position a couple of day ago because this stock has been really strong and in my opinion has not priced in the recent silver and gold moves.  Well the break out started friday and has continued today.  I took profits on 1/2 my position today at 3.89, this was at the end of the day.  The logic behind this is to lock in at least half your profits on big moves because there is a potential of a reversal the next day, Just like the stock markets today.  I was thinking about taking profits at 3.94 but saw a touch of 4.00 and held a bit to long.


The Slow Stoch looks like it could embed and the MACD is position and a positive tick on the histogram confirms a shift in momentum.  I believe this move could be mirrored by the August 3rd move where there was a sharp increase sideways consolidation then a second move up.  I will be looking to add to my position hopefully below the 3.89 mark, I may look for an entry at 3.81


I exited my GPR position even though I expect the stock to continue to rise because I wanted to purchase the stock i analyzed Monday HRG on the TSX.  This stock I believe has just broke out I got in at 1.02 and it ended the day at 1.05 up 9.4% today.  I expect this to continue to break out over this week.

The MACD has a strong up tick today, and the slow stoch is overbought but could be embedding.  Again i will mention about the slope of the yellow line, this stock unlike the over all markets I believe has a better chance of an embedded slow stochs which means the up trend is locked in and strong moves up usually continue until the yellow line breaks below the 80.  The slope is shallow and the white line is very close to the 80 mark as well, which translates to a potential lock in.

I called Monday a breakout of .99 to 1.01 area will cause a breakout, and we had a run up to 1.09.  I may look to add to my position possibly at the 1.02 mark (which is where i entered today).

Monday, September 6, 2010

With Summer over, will reality set in?

It is expected that with labour day over next week should bring some decent size volume.  Vacations are finished for the summer and the wall street gangs should be back in action.  There are some important numbers coming out next week including job numbers and International trade which should give an indication of the trade deficit.
So lets look at the chart of the S&P 500
I didn't include the MACD or the volume however I will comment briefly on them

MACD is below the 0 line which is bearish, however, the momentum has shifted to bullish with a strong positive tick on the histogram.

The volume was quite weak last week.  This entire rally has been on below average volume which is why i am suspect of this rally.  If there was strong bullish volume next week taking us above the 200 MA I might start considering longs.

The Slow Stoch I included to show how steep the incline has been.  From what I have noticed with the slow stoch is that the shallower  (flatter slope) the entry above the 80 line has a greater chance to embed.  Ideally you will have a gradual increase of the yellow line.  The reason for this is that as the yellow line crosses the 80 line the index becomes over bought.  If the white line quickly enters the 80+ zone the chance for the stock / index to embed is much higher.  But in this case the yellow line is signally overbought condition, the white (trialing 5 MA line) is below 50.  It will be 2-3 days overbought then it has a chance to embed.  This is unlikely and i suspect to see a pull back / break down next week. 

The candle sticks show continuation patterns so they are bullish.

As for trend lines, I had the white line in earlier and look where resistance was perfectly found. The white trend line is significant as it is the top of the down trend channel that was formed from the may flash crash and the recent rally 1130 mark.

In theory, entering a short now isn't a bad call as the market is over bought however, i will wait to see how the market receives Obama's speech that has taken place as the market does seem to jump on good news / stimulus news.

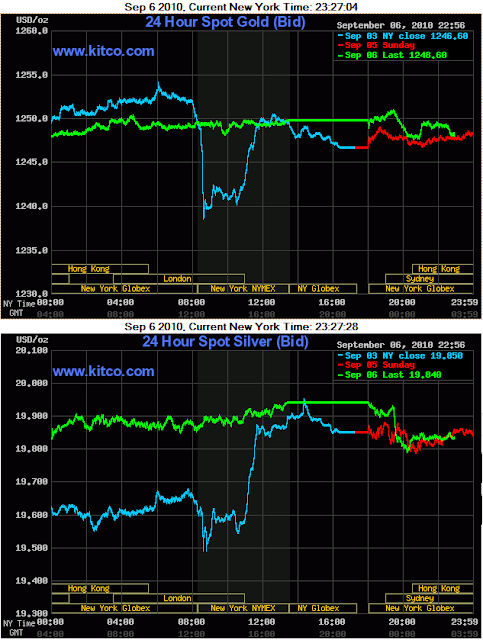
Metal market update. 


Two topics that will be discussed is why silver could have more potential than gold? and silver breakout potential.

First lets look at what happened Sept 3rd which is the light blue chart for both.
The interesting thing about silver is that sometime is trades as a precious metal like gold and other times it trades like a industry metal like copper.  This is simply because it has been used as a currency I believe longer than gold has been used and it is used in thousands of consumer goods such as cell phones, audio equipment and medical applications.  Looking at the price action, as gold drop on the "good" (less bad) economic news, gold took a steep $10+ drop.  Silver had about a 15 cent drop but quickly recovered.  What is the most interesting is that as gold recovered silver followed it upwards to touch the 19.90 range.  So when the economic data came out, silver traded down with a weak correlation with gold as the market data helped keep the silver prices high (as an industrial metal) then as gold traded higher the silver price has a strong correlation.  This is why I think in the world of QE, where the gold market gets a boost and the general market gets a boost (look at the 2009 bull rally in both markets) silver may out perform gold.

About the Break out in silver, it currently is trading at a very high part of its over all range. It closed at the 19.95 area on monday but has since come a bit down to the 19.85 range.  the $20 is significant but i believe the $22-$23 area is the most significant as breaks above this will take us most likely to $32 / oz in silver.  This would be a massive 60% move.  With low COMEX inventories and increased demand in medical applications silver will be interesting to follow over the next 2-3 years.  In addition, if gold gets to 1300 this year expect to see silver rally strong with it.


Sunday, September 5, 2010

High River: Gold mining stock potential breakout

I will be doing an update on the market before tuesday.


I was looking at Investor 500 magazine in the summer 2010 edition, there is a page entitled "Best Turnaround Stocks" From Dec 2009 to Apr 2010 High River gold (HRG on Tsx) stock price increased by 484%.
   Long term daily chart.


Fib levels: Stocks tend to have standard retracements. The levels are 23.6%, 38.2%, 50%, 61.8%.  Also 161.8% is the target of a break out of the 100% level.  On this stock that is 1.57.
As you can see the stock has behaved nicely, finding strong resistance at all these levels.


Moving averages are potential resistance and support, currently they are bullishly aligned since they are in order 20, 50 ,200.  When the prices moves down some of the moving averages cross over, these are significant occurrences that can have an effect on the subsequent price moves.

MACD: This is a momentum oscillator that shows how strong moves are.  the current bullish move was very strong, however it is currently pulled back but the MACD is in positive territory (bullish).

Slow Stoch
Also can show momentum but mainly used for determining oversold and overbought  conditions.  When the yellow line is above the 80 line the stock is overbought, conversely when the yellow line is below the 20 line the stock is oversold.  However, as the yellow line stays above the 80 for 2-3 days, the white line moves into the 80 and above area.  This could be viewed as a lock in of a trend.  many times that lock in can last for a few more days leading to strong positives moves.
The stock above is not overbought but it is getting close. however I view this as potential for a trend lock in.  The slow stoch has just turned back upward showing upward momentum.


So with the technical indicators and the fib levels looking quite positive lets see what has happened in the chart.  A triangle was formed withe the top at 100% retracement and the bottom above the 61.8% retracement.  August 16th, the stock broke the triangle bullishly on strong volume 4-5x more than average.

With the price so close the breakout level and the 1.57 mark the target.  The odds are quite in the favor of this stock moving quickly to the 161.8% after breaking of the 100% level. 0.99 is the breakout level.  so if you put a buy at the 1.00 to 1.02 point, with a stop loss at the .95 for a conservative or .90 if you want to stay in it a bit longer.

I am probably going to take some profits on a silver play, and take this trade.  However it does depend on gold / silver prices next week.  Since gold and silver could be breaking out but there is a potential pull back in the works.  We will see how the metal market acts over the next 2-3 weeks.


Important take away, if the stars align this stock could have a massive move.  The risk on a break of the 1.01 to 1.03 price will be quite low, and you have a tight stop loss that will reduce your downside potential .

I am thinking gold may have a temp pull back but i see it at 1300 relatively soon, next couple of months.  But if highs are taken out and more instability occurs in the economy, a perfect storm of buying will take place.  I want to find some high potential stock for next gold break out.