Market Scheming

Saturday, August 21, 2010

Gold and where is it heading?


I want to start this post by saying I am 100% a gold bull, and expect 1300 to be breached probably by year end.  However, no stock, commodity, forex, etc go straight up or down.  There is a lot of analysis on why gold is a solid investment and people should be looking for places to get good entries.  Well, July 28th was one of the good entry points however, this recent rally it is very hard to say it will continue to new highs.  Why?  There is a bunch of reasons but the one i will provide is that the gold market is in a corrective phase, and the recent dip at the end of July was the beginning, the recent increase will most likely break down to either the July 28th low or a bit below that.   Then we are off to the races.  Remember when this last correct occurs (if it does) will be the BEST entry point for anyone buying gold (physical, stocks, etfs).  So that is the context of this discussion since it is based around the high chance gold is reversing.

Lets look at 4 scenarios right now.

1) Stocks Down, Gold Down
2) Stocks Down, Gold Up
3) Stocks Up, Gold Down
4) Stocks Up, Gold UP

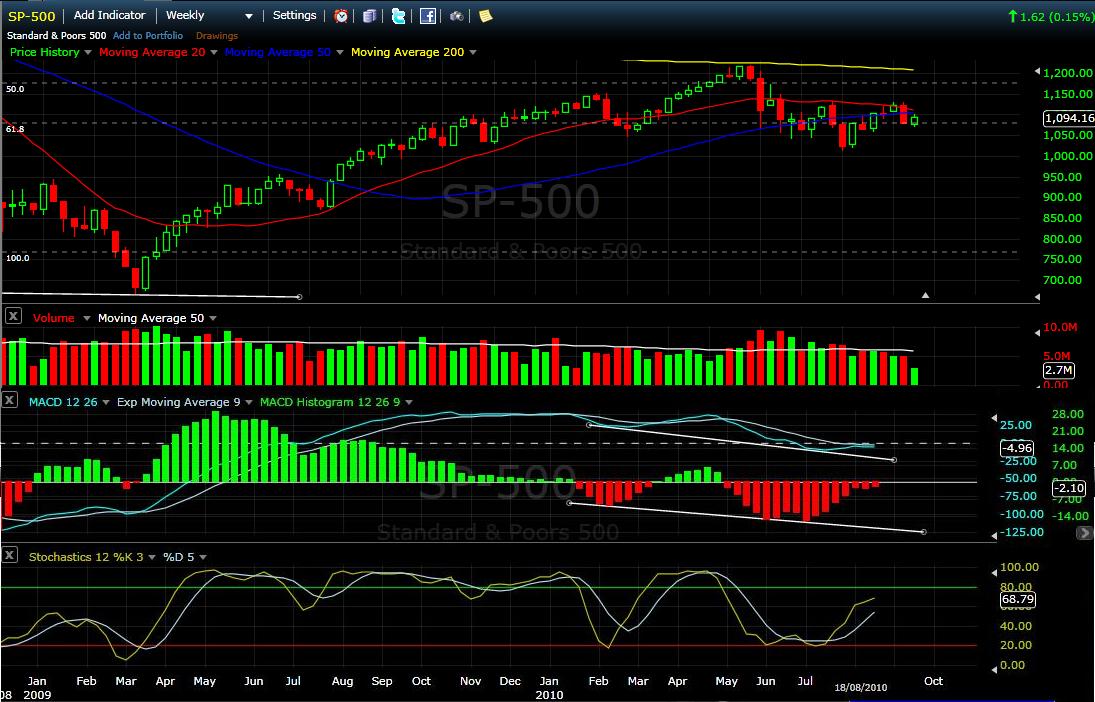
When I refer to stocks I will be using the S&P 500.

First question should be has these moves ever occurred in the past?  If not then we don't really need to consider them.  There is a couple of examples of each but I will only mention one to save space / time.
1) Last crash, gold reach its low at $700.  Between sept 29th and Oct 25th both stocks and gold dropped dramatically.  This time period I am using because from my understand so far I think this is the most likely situation.  This will provide an amazing entry point into the gold market.

2) Following the crash Gold rallied until March 2009 well the stock market retreated to its low at 670.

3) On Dec 1st 2009, there was a period where gold dropped dramatically and S&P rallied for a couple of weeks before it dropped off.  Also in 2008 there was a period of this scenario on March 19th.

4) The rally after the massive stimulus March 11th, 2009 there was a months of gold rallying with gold.


So now we know each of these scenarios can occur, so why do i believe that shorting both gold and the stock market right now is the best call.  First off,  I am already "in the money" on my short of the stock market and will continue to hold this position until the market does move lower. So the question I have been wondering is why short Gold when I think the long term fundamentals are very bullish?  For gold to continue to make new highs this correction is necessary, and will help propel the metal upwards.  If you are interest in gold Elliot wave count I refer to the following.

http://www.youtube.com/watch?v=_BSOJ9hKbD4

Before I get into the technicals of why gold is showing weakness.  Lets consider why this move is an awesome hedge for what ever is coming next week and the weeks after.

If stocks fall, and gold rallies the stop loss is very very tight, I have said this before to friends and i will say it  again, trading from my 4 months of following the markets appears to be all about making low risk trades, some will work out some will not but the idea is stacking the odds in your favor is key.  So with a tight stop loss, if the markets move down and gold moves up, I will lose about 1 % of my trade plus $10 commissions.
Lets say the Markets move up (maybe some crazy news will come out next week, more stimulus or recovery news), people may dump their recent gold positions since it has recently rallied take profits and look to the market.  In this case, I have hedged my losses (same with the alternative case with market sinking and gold rising).  

Now the only case I will be completely out of position is if the stock market rallies and gold rallies.  Lets look at the economics right now.  The hope of recovery has almost been completely dashed, 500K unemployment , housing  not doing well etc.  This situation doesn't really make sense for gold and the stock markets to rally together strongly.  Gold is traditionally a hedge against inflation (Which I think is coming however a period of deflation right now is more likely), also people use it as a place to store money when fear enters the market, but to a lesser extend than the US treasury bonds.  I believe there is a currency crisis coming however I think it is more likely to hit the Euro for the USD which means when fear enters the market people should run to treasury bonds initially, with mass sell offs in all other asset classes.

Gold will recover VERY fast just like in the 2008 collapses after gold dropped with stocks, stocks continued to drop while the recovery of gold took hold starting a major impulse wave up.  That wave has ended and we are in the corrective pattern so a major move up after this drop is likely.

So a quick recap.  I may enter a short position on gold if the price on monday doesn't GAP down huge not allowing an reasonable entry.   Out of the 4 situations listed above, 3 of the I will be probability be better off, with the most unlikely situation (doesn't mean it can't happen) #4 being the only case I will be way out of position.

Lets quickly look a gold and technicals to see why today / monday could be the turning point.


So there are some bearish and bullish signals .....

Bearish:
MACD - A reduction of upwards momentum on Friday. Another tick that is lower than fridays would be pretty good confirmation.

Evening start - candle stick reversal pattern, see below.
http://www.candlestickforum.com/PPF/Parameters/16_540_/candlestick.asp 

At the 78.6% retractment (providing a solid stop loss exit point if the trade is wrong.

Elliot wave - As mentioned in the video posted, this evening star reversal is indicative of gold reversals for almost all reversal patterns.   A C wave down is predicted and should occur before the B wave gets to the top of wave 5.  The C wave in theory should be lower than wave A however, gold is quite bullish long term and the economic climate might cause a double bottom where the C wave stops close to the A wave bottom.

Bullish
Moving averages are stressing me out, since I don't like predicting moves below them since they are strong resistance however, in the 2008 crash this was the exact situation before the drop in both gold and stocks.

Neutral

Slow stoch is technically embedded and could result in a locked in trend to the upside however, the momentum coming into monday is down, and if the yellow line gets below the 80 level we could see a sell off.

Anyways, I will be hopefully entering a position monday with an etf that tracks gold probably a horizen beta pro ETF.

Last thought, I am still thinking about if I should be trading in USD or CAN, since in theory, if everyone rushes to US treasury bonds the USD will rally strongly.  However, I do believe CAN is very strong currency at this point but if the USD is use, I could basically get currency gains.   I still have to think this through more, since I still believe with the Quantitative Easing occurring and probably continuing the USD will fall, I just don't think we are at that point yet.


Friday, August 20, 2010

August 20th close S&P and silver

So today was an interesting day,  sell off then an attempt to claw back some losses.

Lets look where the close occurred, Just above that white trend line i drew in.  Now lets see the importance of this line.  And why i expected it to be either heavy resistance or a close below will follow with heavy selling.     Firstly it is drawn from the second recent lowest low (June 7th) to through the second lowest low after the low, ( July 20th), it also held on the 16th of August for the latest  bounce and held today but was pierced.  Why is this line drawn the way it is and why could it be important.  Well it is draw because now 4 points have tested this line, also ignoring the low around the 5th of July, the two lows that are connected are still in an uptrend.  Matter of fact it is the last hope of an uptrend.  all other short term trend lines are in a down trend.  Now it can be seen as maybe the most important level to hold, since if it breaks the only thing left is the pick line which is a Head / shoulders pattern neckline, oh and where did the wick of the candle stop and bounce of of? Yup that neckline i drew in days ago.  Also the level it held was also the 50% retracement of the latest up leg.  Anyways the bulls did their job holding that level, because they just got above it at 2:40 pm est.  Any attempt to move higher however was quickly bounced back at the 1073 level.  The sell volume is up again today, the MACD has the second day of increase in sell momentum and the slow stoch is not over sold but close.  Things don't look good however there could be a temp bounce monday is some news occurs but GDP  numbers come out Friday and they are expected to be terrible.  That could be the catalyst for a major down turn.  The bounce could occur because of the candle stick formation which is a hammer which could indicate a bottom but it has to be confirmed on Monday.  But there is alot of heavy resistance with all the MA above where it stands right now.

SILVER.....
So I bailed out of a position in one of my favorite silver plays AXR.   I took profits with a 11% gain, and exited this stock at 3.58 which was the end price on the day. The reason i closed this position was because the candle stick formation was a "hanging man"  and the stock looked over extended at this point.  I still have one silver play (FR) in motion which i will look at getting out of it things fail next week.  Lets look at the SLV to see what happen in the silver market.


So my hope that silver follow gold up instead of following the markets down has been dashed for now.  It could still happen but at this point until the 20MA and 50 MA is recaptured I can't be confident that this will hold up against the market turn turn ahead.  The silver mining stocks I use do not always trade with silver moves but the major trends etc will be affected so again it was a good place to take an 11% profit on a trade.
MACD has or is about to cross over.  Slow Stoch has shifted to a downward momentum.  The volume is also up today on the selling.  So what was the alarm bells, the gap below the 20 and 50 MA can't be good.  the only reason i thought silver might have a chance was that it was entering the close of the triangle with the 20 and 50 MA under it.  well what happen? yesterday gap up then pull back below the upper triangle trend line then today a gap down to almost right on the bottom triangle trendline then a sell off that bounced off the 23.6%

Anyways i did up my position in a inverse etf that tracks S&P.  My main reason not to wait for a bounce is that at this point there could be a massive selloff anytime, the likely hood of any form of mass buying is highly unlikely.  Nothing is pointing to good news.  more people losing jobs, less customer confidence, poorer housing market.  Until these numbers improve a downturn is quite likely.  If we get through these moving averages then i might reconsider my position.  


First look at the Nasdaq

So I decided to look at the nasdaq which is something I don't look at as much.  Just wanted to see what type of trends are occurring. And where are we at for tomorrow the 20th of August.

I have a daily and hourly chart, with lots of lines.  I will try to explain them quickly.


Above is a daily chart.  Starting at the yellow line it is the trendline that we are currently holding as of the 19th.  Look at the purple line, it is the part of the top resistance of today.  The light blue line is the gap bottom of the july 2010 gap. it has recently held so any push down could be very very bearish. A push up and it needs to break the light green and green lines, then you could start feeling a bit better.  However breaks below the light red and red line could be very very bearish as well. A break of the red line will have a target of 1500 ish.  which is 17.7% drop.


on the 60 minute, the levels at play are more exposed.  But it is tough to view this market as bullish, with this chart plus the economic back drop.  I am not sure, inflation when it catches up with us could pull this market higher just the currency would be worth less.

On the daily the market is not over sold which means more down side action could occur, Macd also ticking down.

Also look at the fib levels fit pretty well.  50% seems like a very tough level right now.

Tomorrow or earlier next week a big move has to happen regardless.


August 19th thoughts.

Well I don't want to put up to many charts but all my past analysis on this current roll over has been holding true.  So here are some updates on S&P and Silver then a look at the DOW on a 25 year chart to see where we are at.


The Triangle i drew in yesterday has now been slightly broken today with an across the board sell off in stocks.  Also a breach of the 61.8% retracement of the A wave down.  So likely a test of 1000 region is not impossible.  Volume up for today on the heavy selling and the MACD has now had a larger negative tick.  Signally momentum has shifted.  The 50 MA which was helping hold this market up has now broken definitively, confirmation tomorrow would be a nail in the coffin.  The Slow Stoch is not oversold so there is room to move for sure.  That light purple line is what I am watching that will be a pretty bearish signal along with the yellow line.  There could be a heavy batch of sell volume tomorrow or early next week.


This is silver.  I am sort of bearish on this right now since I still feel that silver is viewed as industrial metal.  So an initial drop could occur and up on the chart there has been 2 days of selling.    However, the optimism i have is that there was still a gap up then a sell off that held the 50 MA which was taken out yesterday.  I don't know if that means anything but all i know is that it has to get out of that triangle, and either it will have to drop through 2 MA and the trendline at the bottom or just through the trend line at the top. And we know that it can get above this line.  It has not broken or pierced that bottom line.
MACD doesn't look good however, the slow stoch are not over bought so there is room to go higher.  The sell volume is less than yesterdays as well.

I am holding on my silver positions but have decently tight stop limit orders.  I have a couple silver stocks trades that are positive.  So I want to  cash out before a big crash.  I feel i should have locked in my 12% gain on AXR but I want to see what happens to silver tomorrow when it must decide up or down.


Now lets put this market down turn in perspective......


Dow from 1996 - 2013.  on a 9 day chart.
1) impulse up to the 11750 ish area then it held the 61.8% retractment for 2-3 years and then broke down to the 38.2% retracement and then took off hitting a peak then had a massive retrace of to the 38.2% level held once and then broke through.  The bounce took the DOW over the 61.8% retracement level held that this year a bit and here we are.  Notice the pierce of the 38.2% retracement.  The time period we are in right now, could dictate if we are going to stay above or break below that retractment.  The target I think on this drop might be is in the purple lines. It could still bounce a bit after a couple of dips at this point what news is going to be good.  GDP in Q3 can't be looking very good if there is rising job loss claims and bad news in the  housing market .

Lets play devils advocate here if this is a completion of a Head and shoulders pattern on this size scale the magnitude of what is coming is massive.    Remember, like the previous shoulder chopped up and down for 2-3 years before the big crash.  So it is anyones guess however I don't think, if we continue to break some of these key levels, we will make any new highs any time soon.

I it will be interesting to see the next few months unfold, these may be some chaotic times ahead.

I will post a Friday update. It could stay flat as it is options expiration day! yeah! or it could be a mass panic selling to get out before the weekend.

Wednesday, August 18, 2010

S&P long term outlook

This is a more speculative post.

I want to have a record of this call in case this situation emerges.

Lets look at a 7 day chart of the S&P dating back 1997.

Notice this LONG term head and shoulders pattern that has emerged.  The neck line is around 630ish in 2011.  This could be a logical place to bounce as it has before or if this breaks I am not sure how the market will look.  Notice the magnitude of the right shoulder and how close it is to the Head and notice the right shouder and how possibly it could be much smaller.  To me that would indicate a sharp move regardless.


A closer look at the complex tops of the head and shoulders.  Just like the break down in 2007 - 2008 if this Head and shoulders doesn't  not break to the up side a sharp drop could occur as we complete the right shoulder.  There could be a drop a retest of the neck line a pop up and then a final drop as well.


The Weekly MA don't look good, we are testing the 50 / right now and we found resistance before on the 20.  Unless we can break above 2 Moving averages and the top part of the triangle drawn this market could be in full blown downturn.  It seems like the 1100 mark could be the decider of this battle.  It is technically important and psychologically significant. 

Weekly with techincal indicators. it looks like the Slow Stoch could roll over signaling a downturn in momentum. however the MACD is slightly less negative so pay attention to a cross over or a divergence soon.  Falling volume for sure, and with this you can see the Moving averages a bit better fighting with the price action.


The daily shows where we are today.  Two days in a row the S&P has come to that 1100 level and pulled back.  The Purple line is a Andrews pitchfork channel that I think is helping hold up the market.
Breaks below the 1070 area and again at the 1050 area could be significant.  This triangle will come to an end and we will either be up or down.


Remember tomorrow is the Jobloss claims.  If it is bad, selling will kick in if it is good or neutral the market might break up.


S&P close today...

Three pictures, one is a 5 minute chart the other two are daily charts (short term and long term)


On the 5 minute chart above The close was similar to yesterday, we raced up to the 1098 area and tried to break through the physiological level of 1100 (white horizontal line) but failed and moved down at the end of the day with people not willing to hold over night.   Remember options expiration so volatility could play a big roll by  Friday.
One of the key levels I was watching today was that top purple line, which is my attempt at using the andrew's pitch fork.  This line indicates that we are still below the upper trading range and if this continues to hold it could signal we are heading down.  So the close did seem pretty bearish, with today and yesterday's attempt to break that 1100, there will be some bulls that are not willing to attempt tomorrow.  So it will be interesting to see.


The daily chart of about 2 months, shows some interesting facts.  There is a triangle ending, the S&P is close to the upper part of this range and by 25-26th this triangle will either result in a break up or down.  What is acting as support / resistance.  Well now the 50 day MA is holding up the markets if this break down all MA will be above it.  Right now the 20 / 200 and the triangle trend line is holding it down along with the purple andrews pitchfork.  In addition to this, the 1100 barrier looks very strong.  The Slow Stoch is now not over sold, the MACD is showing a momentum shift to the upside (however still negative) and volume was slightly less than yesterday.  The line to watch is the light purple line drawn in.  A break of this neck tie on a mini head and shoulders could bring us closer to the yellow line which can be seen on the next chart.  The the completion of the right shoulder will happen if either today or tomorrow more down side is recorded, then any break of that neckline should take the S&P to just above the 1000 mark again a very strong psychological barrier 


So where would this break of the mini Head and Shoulders take us? 
Well it could take us below the yellow line which is the original large head and shoulders pattern that developed and broke past couple months.  Why did this break down not materialize?  Well from some research and deduction the first reason was the media really jumped on this head and shoulders so so many people were aware of it that it could have caused a disruption to a normal break down.  Secondly and more importantly the media / government pumped up Q2 earning which helped the rally move up.  Well guess what Q2 earnings are almost over and we maybe entering another down leg, what will save us this time?  In my mind there is some debate over what should be considered the Larger term Head and Shoulders pattern, either the yellow one from the previous version or the more recent white neck line from the original H&S break down.  That would be more logical as it is the most recent / relevant since if the market breaks down there, there is no doubt the recovery has failed. 

Anyways this is my thoughts on possibly where the S&P is heading, I could be 100% wrong but I do know this,  Options expiration has come at a critical time where a big decision has to be made over the next 2 days UP or DOWN.  The next 2 weeks of market action could be very telling.  


Nat gas prediction

I have not touched nat gas for a while.
Looking at the charts I see a very interesting pattern.

the triangle was broken to the downside.  The channel it has been trading in between the cyan and purple lines should provide support resistance well. That is why i expect a pop in prices to the 5.60-5.70 area on the HNU then a break down with that triangle providing strong resistance.  However any break down below the Cyan line will be shorting opportunity for Nat Gas.

Volume seems to favor bears right now with heavy volume dumping this.
The slow stoch is oversold so expect a pop at some point and a logical place is right now after the first bounce off the cyan line.

The MACD has a less negative tick meaning there may be a small turning point in momentum possibly to test the target range of 5.60-5.70.

This is what i would consider a low risk trade since a stop loss just below the cyan line will provide a no brainer exit point.  and the upside potentional is pretty good.  However this chart is bearish and you would be playing a bounce.   When this peaks and if it bounces off that bottom triangle trend line, it could be a good time to load up on HND.


Andrew's Pitchfork!

I am going to attempt to use a study I have not used before.  I used this site to understand how to set up the fork.  http://help.geckosoftware.com/40manual/new/advchart_tools/andrews_pitch/andrew_pitchfork.htm

From the last move corrective move in the S&P an ABC can be drawn, then the fork is setup providing another reason why until we get back up and over that bottom Pitchfork line it would be hard to be bullish in the long term.  In the theory site i posted the last picture at the bottom shows projections, which are identical channels that are mapped out below the current channels that are drawn.  If the S&P bounces off the lower line again it would be safe to say we entered that new channel for at least a test of the bottom of the new channel.  

I have added now a down channel of andrews pitchfork, to the drawing as you can see the push today stopped at almost exactly on to what is draw out, so a close above the new down channel would mean a possible drive up but it will have heavy resistance from the lower trend line of the previous pitchfork.
Also note that volume seems like it dropped off when the trading range was in the upper range versus the volume in the lower trading ranges.


I don't really know how to use this study but if i have set if up correctly, it seems to provide some interesting insight. 

Tuesday, August 17, 2010

S&P patterns and predictions

So here is my doom and gloom view of the charts Top chart is a close up of current situation and where break downs are likely to occur.  And the Bottom chart is the overall picture of our situation dated back to the beginning of this bull market.


I am going to call this Head and shoulders pattern on the purple line being the neck tie.  The right shoulder could get to the 200 MA or it could keen at the 20 MA or even the light blue triangle top.  But when it breakdown if the purple line is broken the S&P should be droping close to 1000- 1020 range.  May be lower.  These are key trends coming to an end.  If the s&p moves up it will likely mover to the 1130 area before meeting heavy resistances.
The Slow stock is just on 20 so barely oversold.   but MACD is showing a slight change in momentum.  So I wouldn't be surprised to see a bit more upside before we begin to break down again.


On the longer term chart, you can see if the yellow line breaks then we are in that previous head and shoulders breakage range in early July.  That would then become quite strong resistance.  A break of the white neck tie I would call as the new Head and shouders pattern with the right shoulder being completed again.  The A wave correction could have been a zig zag ABC, then the start of the B wave was the most recent top and the C wave should be lower than the A wave which would be 950 range.

So expect this market to break down.  Some interesting news that will be coming out that might have a very large impact on the markets if they revise it is the GDP numbers.  This happens on the 28th of this month.  So keep your eyes peeled for this news.

FVI on the TSX

Interesting chart.


It broke out of the triangle and through the 20 MA, if the 200 MA now becomes strong support, the expanding triange would be the next logical target. I don't have this stock but i might look for a position when it starts to bounce off the 200 M


Another low low cap is impact , ipt on the tsx ventures.
The chart is a bit busy but for a reason.

This stock could be breaking out to new highs if it can continue breaking the 50 and 200 MA. I am watching for breaks up and probably going to trade them.


ELD on the tsx I also have a option on, for a 21 strike price.  It expires friday so the likelihood I will be losing on this, but there is a small potential I may be able to cut some losses on looking at the current chart.


A break out of that triangle, that is drawn could result in a spike up to the bollinger band. and maybe to the 19.60 range where i might be able to cut some losses.

Monday, August 16, 2010

Silver and gold update


Silver chart i have below is pretty interesting, it has cleared all move averages and is about to break either up or down from this triangle it is.


the slow stoch is not over bought,, and the macd just upticked, I see a logical target to a be at about 20.25 to 20.45
o much it might bring down silver as it is a industrial / precious metal.

we will see if the stocks market tanks to


looking at gold long term and short.

Seems like in a really good position.  bounce off the 200 MA and now up and above the 50 and the 20 MA. And held above the 61.8% retracement o the last down leg.
a break out over the 100% retracement and the up channel top that it is trading in, would have a target of 127.50.  so over the next 2-3 weeks we will see if it continues up or break down shortly.


Trip to BC, Update on all positions and call for silver

With exams and traveling to bc over, i wanted to update my positions and silver call.

1) Silver call:


This is to show the triangle and the enviable break out up or down.  


On the Daily chart, the gap up today and it has held off staying in that area.   That gap probably will be filled then a takeoff.  The MACD has a strong uptick over the previous day, The Slow stoch has crossed over, and it is not over bought.The volume is up for the day as well. All moving averages are below the price, and the 38.2% retracement.


So I think a pop is pretty close some time this week if it breaks out of the triangle the price could go up to about the 18.39 mark, then to the 19.41.  


look at todays action: 


2) Ford update, the B wave called in previous posts is coming to an end.  The drop in the markets provided this drop, so a target in and around 8.05- 9.50


3) silver plays and entries


AXR entry 3.23, looks like it could pop up and over that 200 MA any day.  IT just broke out of that triangle and if it can hold that we could get to about 3.50 - 3.65, then a test of the 4.00 mark. 


FR entry 4.15, and a 6% gain so far today.  a break of the 4.50ish area could be very bullish.


BEWARE.... Options expiration week, I expect crazy volatility.