Market Scheming

Thursday, September 16, 2010

EDR - Indicators confirm potential breakout

I came across this article on EDR.  It was released in early July when the quarterly results were published.  I have been looking for information on a Mining company that is growing their production of silver.  I believe all silver / gold mining companies will have a strong move up, however, the stocks that will do very well will be the ones that have full scaled production so they can start showing actually cash flow sooner rather than just an increase in assets from their estimated resources appreciating.

"EDR is a small-cap silver mining company focused on the growth of its silver production, reserves and resources in Mexico. Since its startup in 2004, Endeavour has posted five consecutive years of growing silver production and resources. The organic expansion programs now underway at Endeavour's two operating silver mines in Mexico combined with its strategic acquisition and exploration programs should help Endeavour achieve its goal to become the next premier mid-tier silver mining company."

Below is the weekly chart with each indicator explained. 

The Slow Stochastics shows momentum is up but the stock is currently overbought.  It will be shown with the other indicators that this overbought condition will probably become embedded where the yellow and white line stay about the 80 line for an extended period of time.


The MACD on the weekly is super bullish.  The momentum is pointing up, the histogram has just turned positive, and the MACD line is over the zero mark.  This shows me that their is strong momentum behind this move which means that their is a higher chance for the Slow Stoch to embed.


I mentioned in a previous post I was going to start looking into the ADX and -/+ DI indicator.  It is very interesting.  The yellow line represents how strong the trend is and the cross overs of the +DI (Green Line) and -DI (Red Line) serve as possible buy and sell opportunities.   The standard parameters are 14 (smooth) , 10 (DI period).  In that configuration when the yellow line gets above the 20 line, it indicates a strong trend has formed in the direction of what ever DI is on top.  I read about a more accurate setup which is the 13 / 8 setup where the strong trend of the yellow line forms at 25.  As you can see the stock has just broken the 25 mark, in addition to this there was a buy signal (green line crossed over the red) in July. 

So from this indicator you can see which trend is in action and how strong the trend is.  This is a very interesting inductor I will probably continue to use it as a filter for my trading.

Volume and projections

Volume in last December was very strong and since then the price action has remained flat above the 200 MA and the volume has started to decrease. With this sudden move in price action the past three weeks i suspect that more buy volume will enter the markets potentially taking this stock to new highs.

Elliot wave count i have as this is a start of wave 3.  Wave 2 is clearly a triangle and we are in the third week of breaking out of this triangle.  In previous graphs it can be seen that wave 2 was a standard 38.2% retracement of wave 1.  The projections are 100% or 161.8% of wave 1 from the bottom of wave 2.  This would take us to  6.90 or 9.12 dollars respectively. 

I have purchased this stock, with the weekly technicals lined up so well and with the silver price continuing to move up, this stock is poised for a strong wave 3.


Going to the daily, you can see that the Slow stoch is probably going to embed, and the macd is positive with larger positive tick on the histogram than yesterday.  I could even count the daily as we are entering a wave 3.  The first wave started back in August 24th.  A move up past the $5 mark is highly likely. 

Tuesday, September 14, 2010

The race has begun

What race??? The currency debasement race.
From economics 101, a weak currency versus say the USD will help the countries export sector.  Right now the world is at a point where every country wants their currency to weaken to improve trade surpluses. 
The first step was taken today as the Bank of Japan has announced currency intervention.
The bloomberg article is here
Zerohedge has an article here

Below is taken from Zerohedge article which demonstrates the effect of such intervention.


This is Japanese version of QE2, so what happens when the US debase the USD?  Well Japanese Yen will strength again against the greenback, which pave the way for MORE intervention. You can see how this could end up being a slippery slope, which has the potential to lead to a currency war.


The markets in Asian accordingly SOARED, which is what you would expect.  This is another reason why the QE2 from the US will coincided with a low in the markets with the hope to give it a boost.


Gold all time high!

Big day today, Gold getting to 1276 was huge.


The markets were flat, and in my opinion extremely extended but i have to admit they have held up more than i expected.  I am more neutral now on the markets since if QE2 is announced the markets will rally much higher.  Remember though that QE2 is literally printing  money in our new day and age.  So this is also extremely bullish for gold / silver.

The two metal stocks i am holding are doing well, AXR had a 6% increase today while SBB has been flat the past two days holding above the 4.09 level.

CPI / PPI is coming out Thursday / Friday so it will be quite interesting to see how this week will end.


Sunday, September 12, 2010

Diamond Tops

This technical analysis explains diamond tops and how it might effect the NY composite index.
If this scenario completes as expected, he estimate that an 80% reduction in the index might occur.

Well summer behind us, and options expiration is next week

I hope by the end of next week the markets will be clearer.
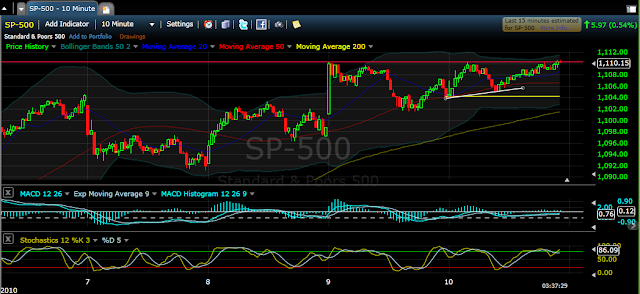
Lets look at an hourly chart to see where the S&P 500 is fighting its battle.


The level this market tested the pass few days is the 1111 level.  The markets have formed a triangle and looks like it has to break up or down.  I will admit i didn't think it would have got this far.  I have been bearish mainly because the economic climate is troubling.  The key level for this market is the 200 daily MA and the 1130 level which is at the top of the previous high.  If there were breaks above this and it held for a few days i would consider going long.
On this hourly chart the MACD is positive so bullish the Slow stoch is technically overbought how ever if it stays above the 80 level for much longer this could be viewed as an embedding of the up trend. 

Lets get a closer look at Fridays action.

The MACD is still bullish and the slow stoch is over bought.   Observe the Slow stoch and how in the morning of the 10th a bearish divergence occurred.  The yellow line made a new low but the price action made a new high.  If you are long this market, please take note of these type of indications of weakness.  So I would keep a tight stop loss.

On a 1 min chart:

This is the last 3 hours of trading.  The market could not close over that red line and the last few minutes you can see profit taking or people that were not willing to hold over night.  The last 2 minutes there was a massive purchase of this markets to close just above that white trend line.


I stayed neutral on this market, but I will short it when some of these levels get broken.  But major shorting at the 1040 level. 

I did decide to hold metal stocks over the weekend which goes against my analysis on Thursday because I do believe the metal markets might need a correction.  This doesn't mean I am bearish it is more like I recognize this isn't a good buying opportunity, however a dip would be a great buying opportunity.

How I positioned myself is with 3 mining stocks that in my mine are quite low risk because entries were close to significant level of support.
SBB I bought sold this stock a few times this week.  Today something happened that I was waiting for but was not in the position i wish i was to completely capitalize on it.   SBB broke out to new highs.  I quickly entered at 4.09.  The close was a steady climb to 4.21.

The Trade

At 1:45 PM I purchased at the price of 4.09.  Which is just above the all time high of 4.08.  Once purchased the 4.09 level was never seen again.  I am learning more about swing trading and this is a low risk entry point for a swing trade.  I setup a stop at 4.05 which is the closest base to the 4.08 top.  If this was a false breakout, the potential loss is 4 cent per share or just less than 1%   (plus commission $10).  Since the 4.08 level is the all time high the odds are in the favor of a continued rally to new highs. 

The target price is as follows:

The 4.55 level is the fib projection.  I would look to get out of my position or setup a stop loss below that area if SBB rallied above it.  Another confirmation that this was a strong move is the volume. Their was one of the heaviest days of volume today with a  9% gain. 

Another position I picked up before close was my favorite silver mining company AXR.  I missed the strong move they had a few weeks back when took profits a day before a major announcement I was waiting for.  The company commenced silver production at their Keno Hills property.  The story is here

The stock had a MASSIVE move to the upside and has since came back to a potential buying opportunity.

 Entry was at 4.34, at the last few minutes, with a stop at 4.24 which is a bit more riskier than the SBB trade.
The Volume behind the last few big moves was massive compare to the average so that is confirmation that there is strong bullish activity. 
The MACD and Slow Stoch are not shown, but the MACD still has a negative tick on the histogram but the momentum is shifting from bearish to bullish.  The Slow Stoch is pointing up and is in the low end which is closer to oversold than overbought again signally that this could be the start of an uptrend.

The other stock i have is HRG that i covered before.  It is actually at the top of its breakout range so I am waiting for it to breakthrough.

The caveat  to this position is that gold and silver are pretty over extended but even the minor sell off of $10 in gold in the middle of the week didn't last very long.  The bullish momentum for gold on a intermediate basis is growing.  So a pull back in the metal market would not be a surprise but this goes again my current position.  However, SBB previous held its position when silver decreased sharply, and AXR has new fundamental data behind.  If metals do break out which some people are expecting this week, with a 1300 gold and 32 dollar silver target on the table by year's end.  These entries with these specific companies could provide a good vehicle to ride the uptrend of a metals breakout.

We will see what next week will bring, but one thing it will bring is volatility, there is a TON of economic data.
China has release information this weekend showing that the inflation rate is creeping up on them.