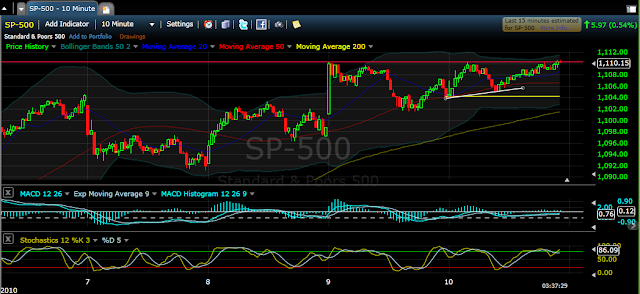
Lets look at an hourly chart to see where the S&P 500 is fighting its battle.
The level this market tested the pass few days is the 1111 level. The markets have formed a triangle and looks like it has to break up or down. I will admit i didn't think it would have got this far. I have been bearish mainly because the economic climate is troubling. The key level for this market is the 200 daily MA and the 1130 level which is at the top of the previous high. If there were breaks above this and it held for a few days i would consider going long.
On this hourly chart the MACD is positive so bullish the Slow stoch is technically overbought how ever if it stays above the 80 level for much longer this could be viewed as an embedding of the up trend.
Lets get a closer look at Fridays action.
The MACD is still bullish and the slow stoch is over bought. Observe the Slow stoch and how in the morning of the 10th a bearish divergence occurred. The yellow line made a new low but the price action made a new high. If you are long this market, please take note of these type of indications of weakness. So I would keep a tight stop loss.
On a 1 min chart:
This is the last 3 hours of trading. The market could not close over that red line and the last few minutes you can see profit taking or people that were not willing to hold over night. The last 2 minutes there was a massive purchase of this markets to close just above that white trend line.
I stayed neutral on this market, but I will short it when some of these levels get broken. But major shorting at the 1040 level.
I did decide to hold metal stocks over the weekend which goes against my analysis on Thursday because I do believe the metal markets might need a correction. This doesn't mean I am bearish it is more like I recognize this isn't a good buying opportunity, however a dip would be a great buying opportunity.
How I positioned myself is with 3 mining stocks that in my mine are quite low risk because entries were close to significant level of support.
SBB I bought sold this stock a few times this week. Today something happened that I was waiting for but was not in the position i wish i was to completely capitalize on it. SBB broke out to new highs. I quickly entered at 4.09. The close was a steady climb to 4.21.
The Trade
At 1:45 PM I purchased at the price of 4.09. Which is just above the all time high of 4.08. Once purchased the 4.09 level was never seen again. I am learning more about swing trading and this is a low risk entry point for a swing trade. I setup a stop at 4.05 which is the closest base to the 4.08 top. If this was a false breakout, the potential loss is 4 cent per share or just less than 1% (plus commission $10). Since the 4.08 level is the all time high the odds are in the favor of a continued rally to new highs.
The target price is as follows:
The 4.55 level is the fib projection. I would look to get out of my position or setup a stop loss below that area if SBB rallied above it. Another confirmation that this was a strong move is the volume. Their was one of the heaviest days of volume today with a 9% gain.
Another position I picked up before close was my favorite silver mining company AXR. I missed the strong move they had a few weeks back when took profits a day before a major announcement I was waiting for. The company commenced silver production at their Keno Hills property. The story is here.
The stock had a MASSIVE move to the upside and has since came back to a potential buying opportunity.
Entry was at 4.34, at the last few minutes, with a stop at 4.24 which is a bit more riskier than the SBB trade.
The Volume behind the last few big moves was massive compare to the average so that is confirmation that there is strong bullish activity.
The MACD and Slow Stoch are not shown, but the MACD still has a negative tick on the histogram but the momentum is shifting from bearish to bullish. The Slow Stoch is pointing up and is in the low end which is closer to oversold than overbought again signally that this could be the start of an uptrend.
The other stock i have is HRG that i covered before. It is actually at the top of its breakout range so I am waiting for it to breakthrough.
The caveat to this position is that gold and silver are pretty over extended but even the minor sell off of $10 in gold in the middle of the week didn't last very long. The bullish momentum for gold on a intermediate basis is growing. So a pull back in the metal market would not be a surprise but this goes again my current position. However, SBB previous held its position when silver decreased sharply, and AXR has new fundamental data behind. If metals do break out which some people are expecting this week, with a 1300 gold and 32 dollar silver target on the table by year's end. These entries with these specific companies could provide a good vehicle to ride the uptrend of a metals breakout.
We will see what next week will bring, but one thing it will bring is volatility, there is a TON of economic data.
China has release information this weekend showing that the inflation rate is creeping up on them.


No comments:
Post a Comment